pypi_packages: datasette-dashboards
This data as json
| name | summary | classifiers | description | author | author_email | description_content_type | home_page | keywords | license | maintainer | maintainer_email | package_url | platform | project_url | project_urls | release_url | requires_dist | requires_python | version | yanked | yanked_reason |
|---|---|---|---|---|---|---|---|---|---|---|---|---|---|---|---|---|---|---|---|---|---|
| datasette-dashboards | Datasette plugin providing data dashboards from metadata | [] | # datasette-dashboards > Datasette plugin providing data dashboards from metadata [](https://pypi.org/project/datasette-dashboards/) [](https://github.com/rclement/datasette-dashboards/actions/workflows/ci-cd.yml) [](https://codecov.io/gh/rclement/datasette-dashboards) [](https://github.com/rclement/datasette-dashboards/blob/master/LICENSE) Try out a live demo at [https://datasette-dashboards-demo.vercel.app](https://datasette-dashboards-demo.vercel.app/-/dashboards) **WARNING**: this plugin is still experimental and not ready for production. Some breaking changes might happen between releases before reaching a stable version. Use it at your own risks! 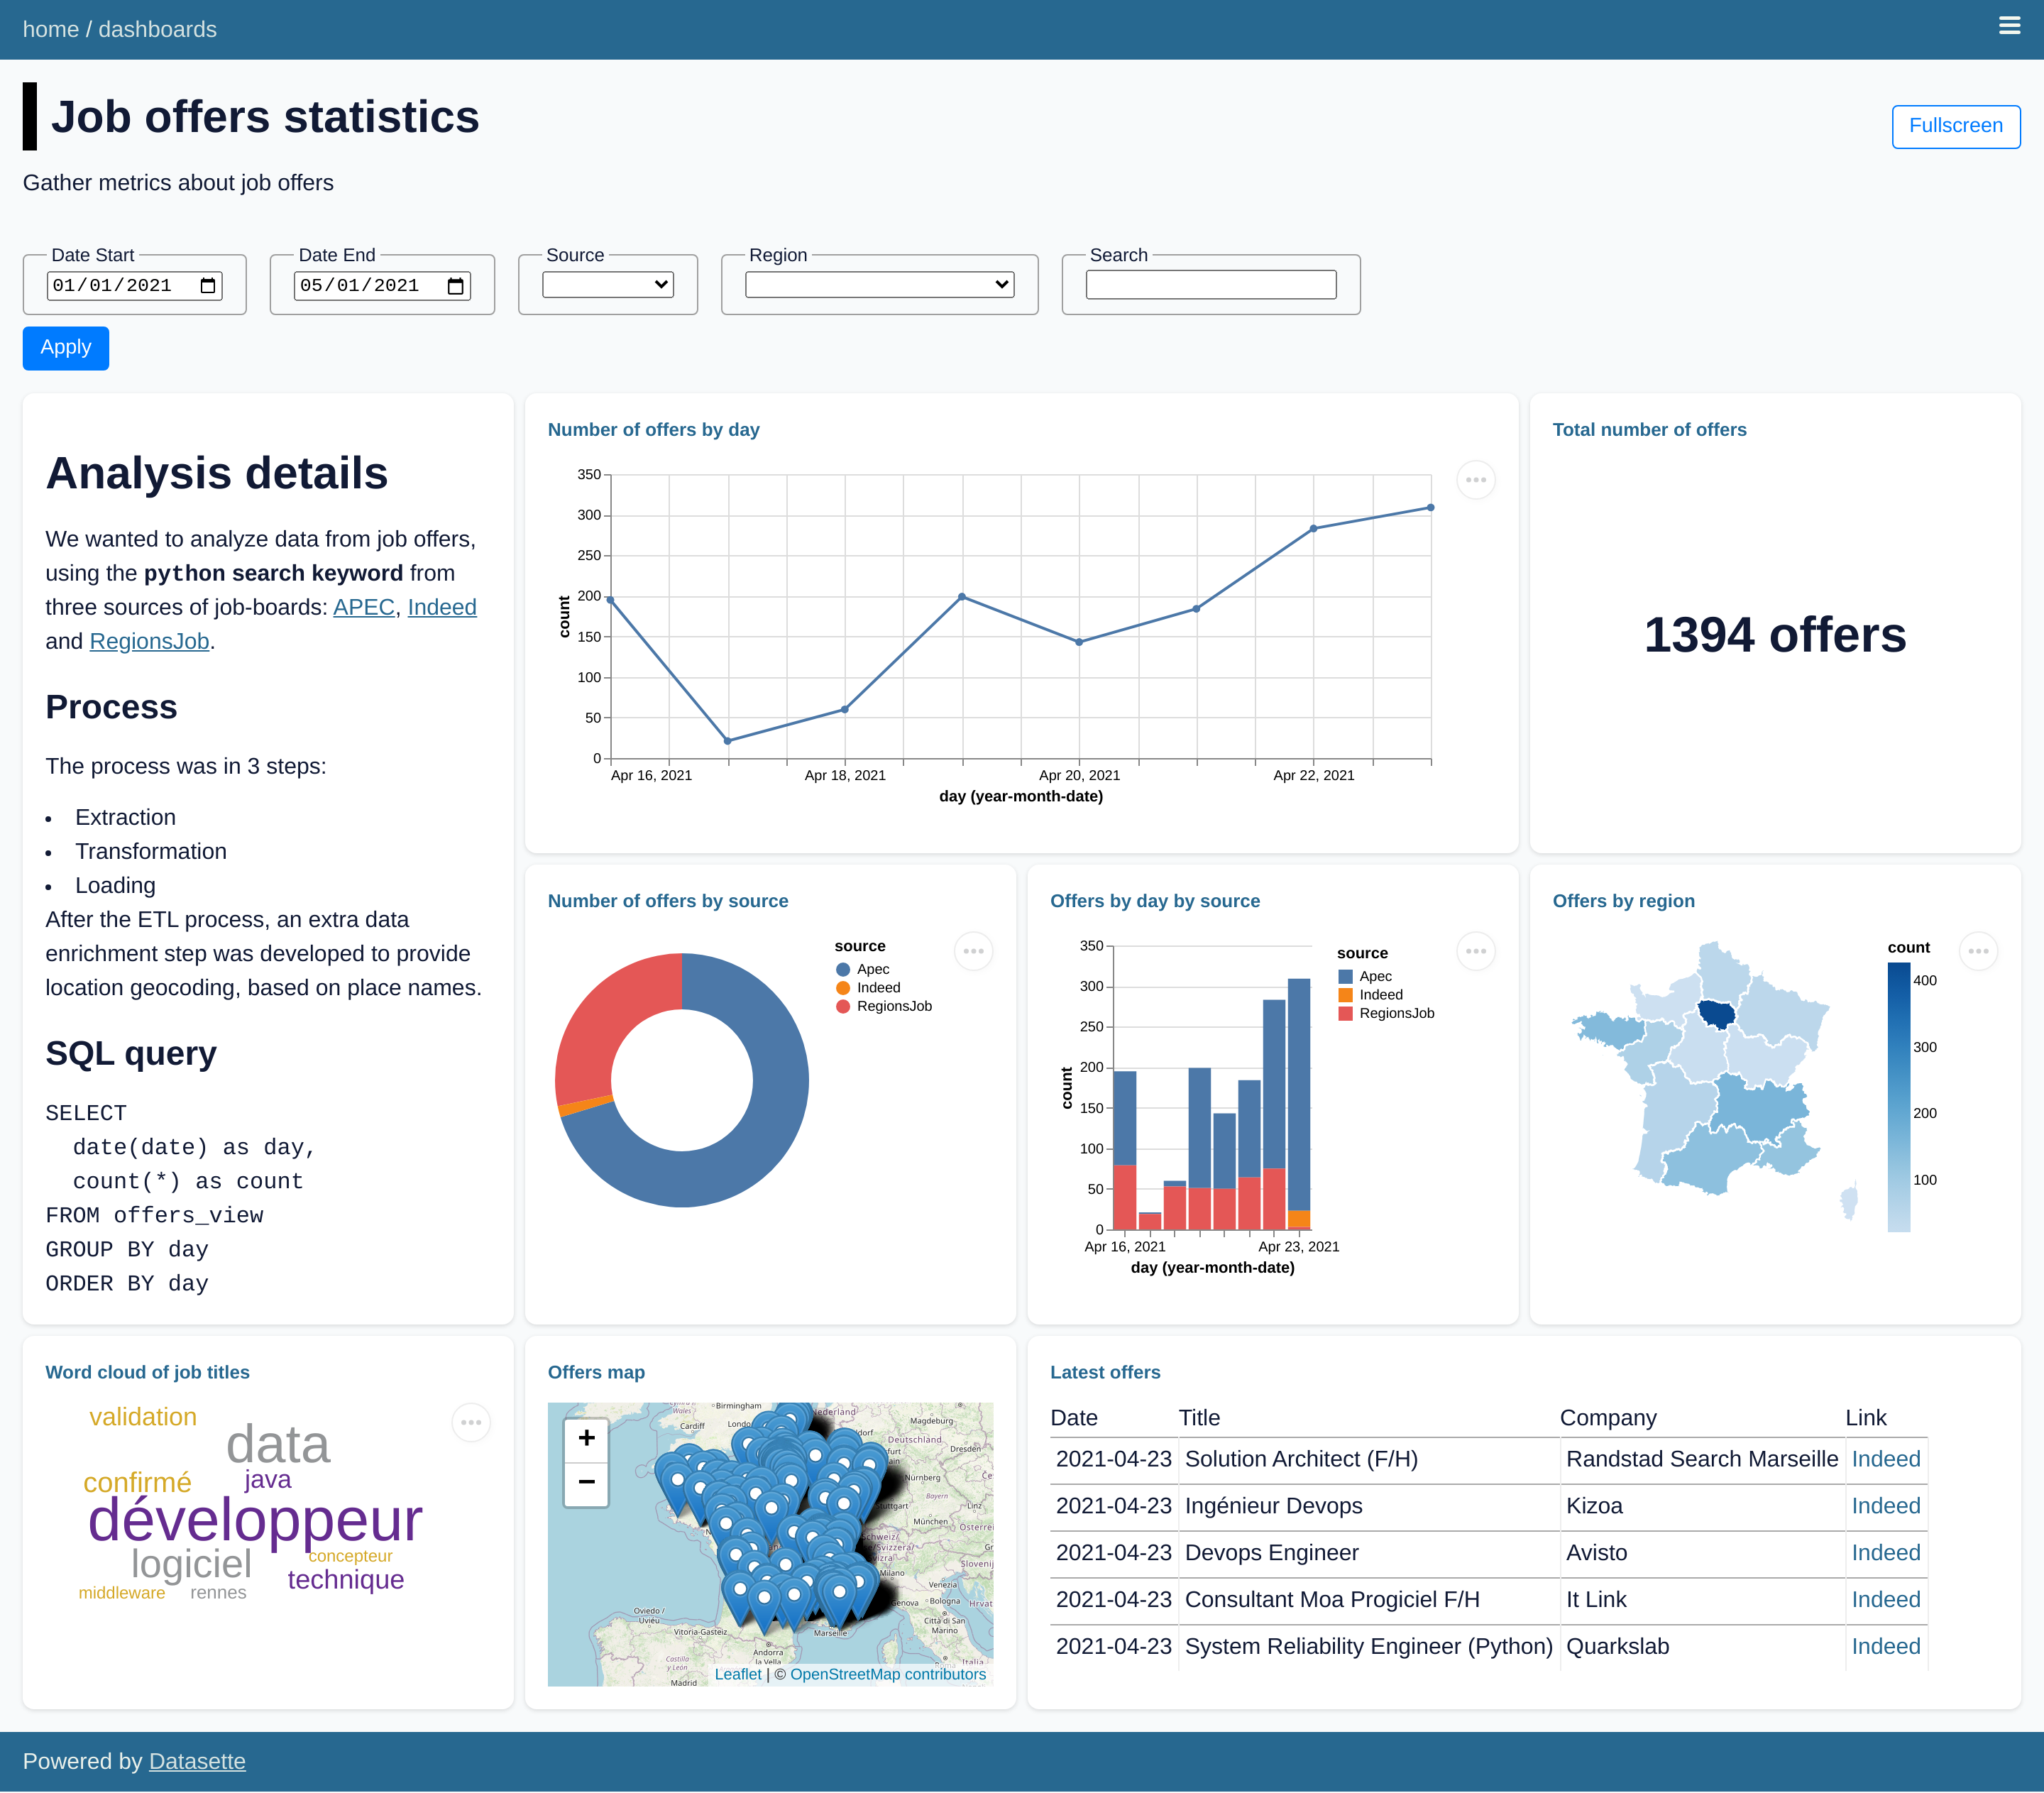 ## Installation Install this plugin in the same environment as Datasette: ```bash $ datasette install datasette-dashboards ``` ## Usage Define dashboards within `metadata.yml` / `metadata.json`: ```yaml plugins: datasette-dashboards: my-dashboard: title: My Dashboard description: Showing some nice metrics layout: - [analysis-note, events-count] - [analysis-note, events-source] filters: date_start: name: Date Start type: date default: "2021-01-01" date_end: name: Date End type: date charts: analysis-note: library: markdown display: |- # Analysis notes > A quick rundown of events statistics and KPIs events-count: title: Total number of events db: jobs query: SELECT count(*) as count FROM events library: metric display: field: count prefix: suffix: events-source: title: Number of events by source db: jobs query: SELECT source, count(*) as count FROM events WHERE TRUE [[ AND date >= date(:date_start) ]] [[ AND date <= date(:date_end) ]] GROUP BY source ORDER BY count DESC library: vega display: mark: { type: bar, tooltip: true } encoding: color: { field: source, type: nominal } theta: { field: count, type: quantitative } ``` A new menu entry is now available, pointing at `/-/dashboards` to access all defined dashboards. ### Properties Dashboard properties: | Property | Type | Description | | ------------- | -------- | --------------------- | | `title` | `string` | Dashboard title | | `description` | `string` | Dashboard description | | `layout` | `array` | Dashboard layout | | `filters` | `object` | Dashboard filters | Dashboard filters: | Property | Type | Description | | --------- | ------------------ | -------------------------------------- | | `name` | `string` | Filter display name | | `type` | `string` | Filter type (`text`, `date`, `number`) | | `default` | `string`, `number` | (optional) Filter default value | | `min` | `number` | (optional) Filter minimum value | | `max` | `number` | (optional) Filter maximum value | | `step` | `number` | (optional) Filter stepping value | Common chart properties for all chart types: | Property | Type | Description | | --------- | -------- | -------------------------------------------------------- | | `title` | `string` | Chart title | | `db` | `string` | Database name against which to run the query | | `query` | `string` | SQL query to run and extract data from | | `library` | `string` | One of supported libraries: `vega`, `markdown`, `metric` | | `display` | `object` | Chart display specification (depend on the used library) | To define SQL queries using dashboard filters: ```sql SELECT * FROM mytable [[ WHERE col >= :my_filter ]] ``` ```sql SELECT * FROM mytable WHERE TRUE [[ AND col1 = :my_filter_1 ]] [[ AND col2 = :my_filter_2 ]] ``` #### Vega properties Available configuration for `vega` charts: | Property | Type | Description | | --------- | -------- | ------------------------- | | `library` | `string` | Must be set to `vega` | | `display` | `object` | Vega specification object | Notes about the `display` property: - Requires a valid [Vega specification object](https://vega.github.io/vega-lite/docs/) - Some fields are pre-defined: `$schema`, `title`, `width`, `view`, `config`, `data` - All fields are passed along as-is (overriding pre-defined fields if any) - Only `mark` and `encoding` fields are required as the bare-minimum #### Markdown properties Available configuration for `markdown` chart: | Property | Type | Description | | --------- | -------- | ------------------------------------------------- | | `library` | `string` | Must be set to `markdown` | | `display` | `string` | Multi-line string containing the Markdown content | Note : - Some common properties do not apply and can be omitted: `title`, `db`, `query` - Markdown rendering is done by [`datasette-render-markdown`](https://datasette.io/plugins/datasette-render-markdown) - To configure Markdown rendering, extensions can be enabled in [metadata](https://datasette.io/plugins/datasette-render-markdown#user-content-markdown-extensions) #### Metric properties Available configuration for `metric` chart: | Property | Type | Description | | ---------------- | -------- | ----------------------------------------- | | `library` | `string` | Must be set to `metric` | | `display.field` | `string` | Numerical field to be displayed as metric | | `display.prefix` | `string` | Prefix to be displayed before metric | | `display.suffix` | `string` | Prefix to be displayed after metric | Note: - The `display.field` must reference a single-numerical value from the SQL query (e.g. numerical `number` field in `SELECT count(*) as number FROM events`) ### Dashboard layout The default dashboard layout will present two charts per row (one per row on mobile). To make use of custom dashboard layout using [CSS Grid Layout](https://developer.mozilla.org/en-US/docs/Web/CSS/CSS_Grid_Layout), define the `layout` array property as a grid / matrix: - Each entry represents a row of charts - Each column is referring a chart by its property name ## Development To set up this plugin locally, first checkout the code. Then create a new virtual environment and the required dependencies: ```bash pipenv install -d pipenv shell ``` To run the tests: ```bash pytest ``` ## Demo With the developmnent environment setup, you can run the demo locally: ```bash datasette --metadata demo/metadata.yml demo/jobs.db ``` ## License Licensed under Apache License, Version 2.0 Copyright (c) 2021 - present Romain Clement | Romain Clement | text/markdown | https://github.com/rclement/datasette-dashboards | Apache License, Version 2.0 | https://pypi.org/project/datasette-dashboards/ | https://pypi.org/project/datasette-dashboards/ | {"Changelog": "https://github.com/rclement/datasette-dashboards/blob/master/CHANGELOG.md", "Homepage": "https://github.com/rclement/datasette-dashboards"} | https://pypi.org/project/datasette-dashboards/0.2.0/ | ["datasette", "datasette-render-markdown", "faker ; extra == 'test'", "pytest ; extra == 'test'", "pytest-asyncio ; extra == 'test'", "sqlite-utils ; extra == 'test'"] | >=3.7 | 0.2.0 | 0 |