pypi_packages: datasette-leaflet-freedraw
This data as json
| name | summary | classifiers | description | author | author_email | description_content_type | home_page | keywords | license | maintainer | maintainer_email | package_url | platform | project_url | project_urls | release_url | requires_dist | requires_python | version | yanked | yanked_reason |
|---|---|---|---|---|---|---|---|---|---|---|---|---|---|---|---|---|---|---|---|---|---|
| datasette-leaflet-freedraw | Draw polygons on maps in Datasette | [] | # datasette-leaflet-freedraw [](https://pypi.org/project/datasette-leaflet-freedraw/) [](https://github.com/simonw/datasette-leaflet-freedraw/releases) [](https://github.com/simonw/datasette-leaflet-freedraw/actions?query=workflow%3ATest) [](https://github.com/simonw/datasette-leaflet-freedraw/blob/main/LICENSE) Draw polygons on maps in Datasette Project background: [Drawing shapes on a map to query a SpatiaLite database](https://simonwillison.net/2021/Jan/24/drawing-shapes-spatialite/). ## Installation Install this plugin in the same environment as Datasette. $ datasette install datasette-leaflet-freedraw ## Usage If a table has a SpatiaLite `geometry` column, the plugin will add a map interface to the table page allowing users to draw a shape on the map to find rows with a geometry that intersects that shape. The plugin can also work with arbitrary SQL queries. There it looks for input fields with a name of `freedraw` or that ends in `_freedraw` and replaces them with a map interface. The map interface uses the [FreeDraw](https://freedraw.herokuapp.com/) Leaflet plugin. ## Demo You can try out this plugin to run searches against the GreenInfo Network California Protected Areas Database. Here's [an example query](https://calands.datasettes.com/calands?sql=select%0D%0A++AsGeoJSON%28geometry%29%2C+*%0D%0Afrom%0D%0A++CPAD_2020a_SuperUnits%0D%0Awhere%0D%0A++PARK_NAME+like+%27%25mini%25%27+and%0D%0A++Intersects%28GeomFromGeoJSON%28%3Afreedraw%29%2C+geometry%29+%3D+1%0D%0A++and+CPAD_2020a_SuperUnits.rowid+in+%28%0D%0A++++select%0D%0A++++++rowid%0D%0A++++from%0D%0A++++++SpatialIndex%0D%0A++++where%0D%0A++++++f_table_name+%3D+%27CPAD_2020a_SuperUnits%27%0D%0A++++++and+search_frame+%3D+GeomFromGeoJSON%28%3Afreedraw%29%0D%0A++%29&freedraw=%7B%22type%22%3A%22MultiPolygon%22%2C%22coordinates%22%3A%5B%5B%5B%5B-122.42202758789064%2C37.82280243352759%5D%2C%5B-122.39868164062501%2C37.823887203271454%5D%2C%5B-122.38220214843751%2C37.81846319511331%5D%2C%5B-122.35061645507814%2C37.77071473849611%5D%2C%5B-122.34924316406251%2C37.74465712069939%5D%2C%5B-122.37258911132814%2C37.703380457832374%5D%2C%5B-122.39044189453125%2C37.690340943717715%5D%2C%5B-122.41241455078126%2C37.680559803205135%5D%2C%5B-122.44262695312501%2C37.67295135774715%5D%2C%5B-122.47283935546876%2C37.67295135774715%5D%2C%5B-122.52502441406251%2C37.68382032669382%5D%2C%5B-122.53463745117189%2C37.6892542140253%5D%2C%5B-122.54699707031251%2C37.690340943717715%5D%2C%5B-122.55798339843751%2C37.72945260537781%5D%2C%5B-122.54287719726564%2C37.77831314799672%5D%2C%5B-122.49893188476564%2C37.81303878836991%5D%2C%5B-122.46185302734376%2C37.82822612280363%5D%2C%5B-122.42889404296876%2C37.82822612280363%5D%2C%5B-122.42202758789064%2C37.82280243352759%5D%5D%5D%5D%7D) showing mini parks in San Francisco: ```sql select AsGeoJSON(geometry), * from CPAD_2020a_SuperUnits where PARK_NAME like '%mini%' and Intersects(GeomFromGeoJSON(:freedraw), geometry) = 1 and CPAD_2020a_SuperUnits.rowid in ( select rowid from SpatialIndex where f_table_name = 'CPAD_2020a_SuperUnits' and search_frame = GeomFromGeoJSON(:freedraw) ) ``` 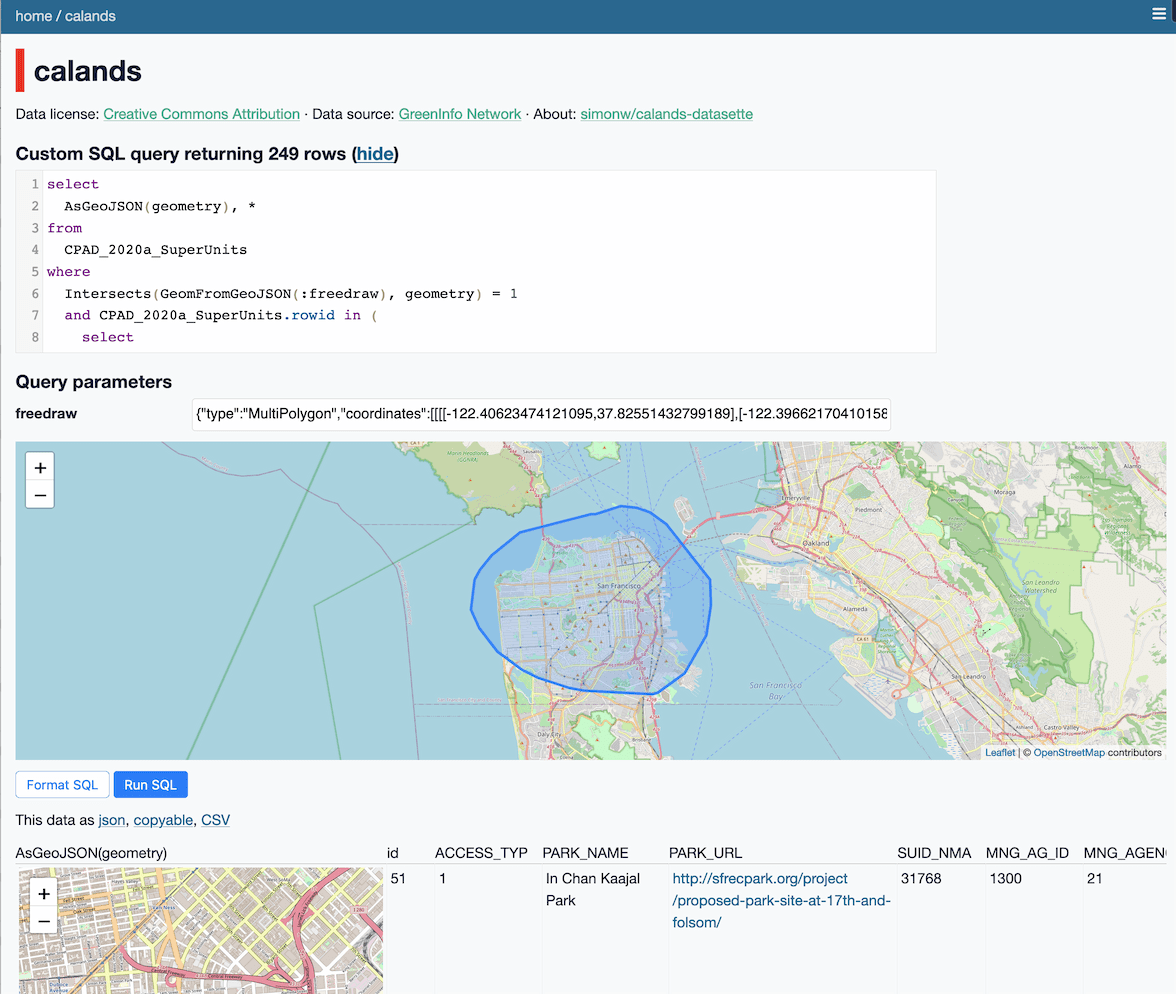 ## Development To set up this plugin locally, first checkout the code. Then create a new virtual environment: cd datasette-leaflet-freedraw python3 -mvenv venv source venv/bin/activate Or if you are using `pipenv`: pipenv shell Now install the dependencies and tests: pip install -e '.[test]' To run the tests: pytest | Simon Willison | text/markdown | https://github.com/simonw/datasette-leaflet-freedraw | Apache License, Version 2.0 | https://pypi.org/project/datasette-leaflet-freedraw/ | https://pypi.org/project/datasette-leaflet-freedraw/ | {"CI": "https://github.com/simonw/datasette-leaflet-freedraw/actions", "Changelog": "https://github.com/simonw/datasette-leaflet-freedraw/releases", "Homepage": "https://github.com/simonw/datasette-leaflet-freedraw", "Issues": "https://github.com/simonw/datasette-leaflet-freedraw/issues"} | https://pypi.org/project/datasette-leaflet-freedraw/0.3.1/ | ["datasette (>=0.60)", "datasette-leaflet (>=0.2)", "pytest ; extra == 'test'", "pytest-asyncio ; extra == 'test'"] | >=3.6 | 0.3.1 | 0 |