repos: 135007287
This data as json
| id | node_id | name | full_name | private | owner | html_url | description | fork | created_at | updated_at | pushed_at | homepage | size | stargazers_count | watchers_count | language | has_issues | has_projects | has_downloads | has_wiki | has_pages | forks_count | archived | disabled | open_issues_count | license | topics | forks | open_issues | watchers | default_branch | permissions | temp_clone_token | organization | network_count | subscribers_count | readme | readme_html | allow_forking | visibility | is_template | template_repository | web_commit_signoff_required | has_discussions |
|---|---|---|---|---|---|---|---|---|---|---|---|---|---|---|---|---|---|---|---|---|---|---|---|---|---|---|---|---|---|---|---|---|---|---|---|---|---|---|---|---|---|---|---|---|
| 135007287 | MDEwOlJlcG9zaXRvcnkxMzUwMDcyODc= | datasette-leaflet-geojson | simonw/datasette-leaflet-geojson | 0 | 9599 | https://github.com/simonw/datasette-leaflet-geojson | Datasette plugin that replaces any GeoJSON column values with a Leaflet map. | 0 | 2018-05-27T01:42:30Z | 2022-08-26T23:27:11Z | 2022-08-26T23:27:08Z | 91 | 9 | 9 | Python | 1 | 1 | 1 | 1 | 0 | 4 | 0 | 0 | 3 | ["datasette", "datasette-io", "datasette-plugin", "gis", "leaflet"] | 4 | 3 | 9 | main | {"admin": false, "maintain": false, "push": false, "triage": false, "pull": false} | 4 | 2 | # datasette-leaflet-geojson [](https://pypi.org/project/datasette-leaflet-geojson/) [](https://github.com/simonw/datasette-leaflet-geojson/releases) [](https://github.com/simonw/datasette-leaflet-geojson/actions?query=workflow%3ATest) [](https://github.com/simonw/datasette-leaflet-geojson/blob/main/LICENSE) Datasette plugin that replaces any GeoJSON column values with a Leaflet map ## Installation Install this plugin in the same environment as Datasette. $ datasette install datasette-leaflet-geojson ## Usage Any columns containing valid GeoJSON strings will have their contents replaced with a Leaflet map when they are displayed in the Datasette interface. ## Demo You can try this plugin out at https://calands.datasettes.com/calands/superunits_with_maps 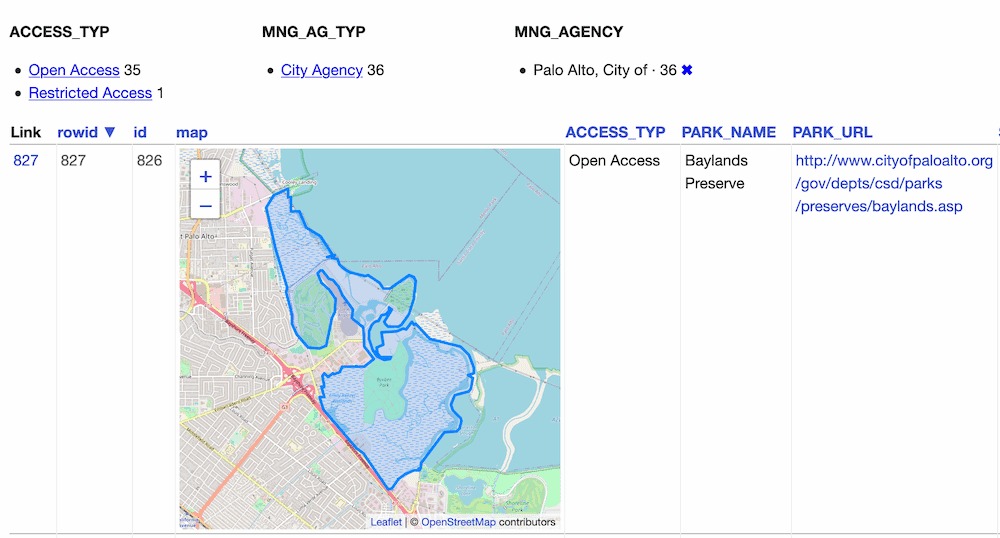 ## Configuration By default this plugin displays maps for the first ten rows, and shows a "Click to load map" prompt for rows past the first ten. You can change this limit using the `default_maps_to_load` plugin configuration setting. Add this to your `metadata.json`: ```json { "plugins": { "datasette-leaflet-geojson": { "default_maps_to_load": 20 } } } ``` Then run Datasette with `datasette mydb.db -m metadata.json`. | <div id="readme" class="md" data-path="README.md"><article class="markdown-body entry-content container-lg" itemprop="text"><h1 dir="auto"><a id="user-content-datasette-leaflet-geojson" class="anchor" aria-hidden="true" href="#user-content-datasette-leaflet-geojson"><svg class="octicon octicon-link" viewBox="0 0 16 16" version="1.1" width="16" height="16" aria-hidden="true"><path fill-rule="evenodd" d="M7.775 3.275a.75.75 0 001.06 1.06l1.25-1.25a2 2 0 112.83 2.83l-2.5 2.5a2 2 0 01-2.83 0 .75.75 0 00-1.06 1.06 3.5 3.5 0 004.95 0l2.5-2.5a3.5 3.5 0 00-4.95-4.95l-1.25 1.25zm-4.69 9.64a2 2 0 010-2.83l2.5-2.5a2 2 0 012.83 0 .75.75 0 001.06-1.06 3.5 3.5 0 00-4.95 0l-2.5 2.5a3.5 3.5 0 004.95 4.95l1.25-1.25a.75.75 0 00-1.06-1.06l-1.25 1.25a2 2 0 01-2.83 0z"></path></svg></a>datasette-leaflet-geojson</h1> <p dir="auto"><a href="https://pypi.org/project/datasette-leaflet-geojson/" rel="nofollow"><img src="https://camo.githubusercontent.com/c4cff7db933b6c868aae197528f088312b804050a0aad5ba2beaa8c2cbf23d72/68747470733a2f2f696d672e736869656c64732e696f2f707970692f762f6461746173657474652d6c6561666c65742d67656f6a736f6e2e737667" alt="PyPI" data-canonical-src="https://img.shields.io/pypi/v/datasette-leaflet-geojson.svg" style="max-width: 100%;"></a> <a href="https://github.com/simonw/datasette-leaflet-geojson/releases"><img src="https://camo.githubusercontent.com/2ac8aa347c051365984375e84c15b4887c4a377dbc495db5320ebfbc409bbb2b/68747470733a2f2f696d672e736869656c64732e696f2f6769746875622f762f72656c656173652f73696d6f6e772f6461746173657474652d6c6561666c65742d67656f6a736f6e3f696e636c7564655f70726572656c6561736573266c6162656c3d6368616e67656c6f67" alt="Changelog" data-canonical-src="https://img.shields.io/github/v/release/simonw/datasette-leaflet-geojson?include_prereleases&label=changelog" style="max-width: 100%;"></a> <a href="https://github.com/simonw/datasette-leaflet-geojson/actions?query=workflow%3ATest"><img src="https://github.com/simonw/datasette-leaflet-geojson/workflows/Test/badge.svg" alt="Tests" style="max-width: 100%;"></a> <a href="https://github.com/simonw/datasette-leaflet-geojson/blob/main/LICENSE"><img src="https://camo.githubusercontent.com/1698104e976c681143eb0841f9675c6f802bb7aa832afc0c7a4e719b1f3cf955/68747470733a2f2f696d672e736869656c64732e696f2f62616467652f6c6963656e73652d417061636865253230322e302d626c75652e737667" alt="License" data-canonical-src="https://img.shields.io/badge/license-Apache%202.0-blue.svg" style="max-width: 100%;"></a></p> <p dir="auto">Datasette plugin that replaces any GeoJSON column values with a Leaflet map</p> <h2 dir="auto"><a id="user-content-installation" class="anchor" aria-hidden="true" href="#user-content-installation"><svg class="octicon octicon-link" viewBox="0 0 16 16" version="1.1" width="16" height="16" aria-hidden="true"><path fill-rule="evenodd" d="M7.775 3.275a.75.75 0 001.06 1.06l1.25-1.25a2 2 0 112.83 2.83l-2.5 2.5a2 2 0 01-2.83 0 .75.75 0 00-1.06 1.06 3.5 3.5 0 004.95 0l2.5-2.5a3.5 3.5 0 00-4.95-4.95l-1.25 1.25zm-4.69 9.64a2 2 0 010-2.83l2.5-2.5a2 2 0 012.83 0 .75.75 0 001.06-1.06 3.5 3.5 0 00-4.95 0l-2.5 2.5a3.5 3.5 0 004.95 4.95l1.25-1.25a.75.75 0 00-1.06-1.06l-1.25 1.25a2 2 0 01-2.83 0z"></path></svg></a>Installation</h2> <p dir="auto">Install this plugin in the same environment as Datasette.</p> <div class="snippet-clipboard-content notranslate position-relative overflow-auto" data-snippet-clipboard-copy-content="$ datasette install datasette-leaflet-geojson"><pre class="notranslate"><code>$ datasette install datasette-leaflet-geojson </code></pre></div> <h2 dir="auto"><a id="user-content-usage" class="anchor" aria-hidden="true" href="#user-content-usage"><svg class="octicon octicon-link" viewBox="0 0 16 16" version="1.1" width="16" height="16" aria-hidden="true"><path fill-rule="evenodd" d="M7.775 3.275a.75.75 0 001.06 1.06l1.25-1.25a2 2 0 112.83 2.83l-2.5 2.5a2 2 0 01-2.83 0 .75.75 0 00-1.06 1.06 3.5 3.5 0 004.95 0l2.5-2.5a3.5 3.5 0 00-4.95-4.95l-1.25 1.25zm-4.69 9.64a2 2 0 010-2.83l2.5-2.5a2 2 0 012.83 0 .75.75 0 001.06-1.06 3.5 3.5 0 00-4.95 0l-2.5 2.5a3.5 3.5 0 004.95 4.95l1.25-1.25a.75.75 0 00-1.06-1.06l-1.25 1.25a2 2 0 01-2.83 0z"></path></svg></a>Usage</h2> <p dir="auto">Any columns containing valid GeoJSON strings will have their contents replaced with a Leaflet map when they are displayed in the Datasette interface.</p> <h2 dir="auto"><a id="user-content-demo" class="anchor" aria-hidden="true" href="#user-content-demo"><svg class="octicon octicon-link" viewBox="0 0 16 16" version="1.1" width="16" height="16" aria-hidden="true"><path fill-rule="evenodd" d="M7.775 3.275a.75.75 0 001.06 1.06l1.25-1.25a2 2 0 112.83 2.83l-2.5 2.5a2 2 0 01-2.83 0 .75.75 0 00-1.06 1.06 3.5 3.5 0 004.95 0l2.5-2.5a3.5 3.5 0 00-4.95-4.95l-1.25 1.25zm-4.69 9.64a2 2 0 010-2.83l2.5-2.5a2 2 0 012.83 0 .75.75 0 001.06-1.06 3.5 3.5 0 00-4.95 0l-2.5 2.5a3.5 3.5 0 004.95 4.95l1.25-1.25a.75.75 0 00-1.06-1.06l-1.25 1.25a2 2 0 01-2.83 0z"></path></svg></a>Demo</h2> <p dir="auto">You can try this plugin out at <a href="https://calands.datasettes.com/calands/superunits_with_maps" rel="nofollow">https://calands.datasettes.com/calands/superunits_with_maps</a></p> <p dir="auto"><a target="_blank" rel="noopener noreferrer" href="https://camo.githubusercontent.com/6c5c71d68f222ee61e234b56d982f9672a8c2707dc9f95fa8084dfe11843a48e/68747470733a2f2f7261772e6769746875622e636f6d2f73696d6f6e772f6461746173657474652d6c6561666c65742d67656f6a736f6e2f6d61696e2f6461746173657474652d6c6561666c65742d67656f6a736f6e2e706e67"><img src="https://camo.githubusercontent.com/6c5c71d68f222ee61e234b56d982f9672a8c2707dc9f95fa8084dfe11843a48e/68747470733a2f2f7261772e6769746875622e636f6d2f73696d6f6e772f6461746173657474652d6c6561666c65742d67656f6a736f6e2f6d61696e2f6461746173657474652d6c6561666c65742d67656f6a736f6e2e706e67" alt="datasette-leaflet-geojson in action" data-canonical-src="https://raw.github.com/simonw/datasette-leaflet-geojson/main/datasette-leaflet-geojson.png" style="max-width: 100%;"></a></p> <h2 dir="auto"><a id="user-content-configuration" class="anchor" aria-hidden="true" href="#user-content-configuration"><svg class="octicon octicon-link" viewBox="0 0 16 16" version="1.1" width="16" height="16" aria-hidden="true"><path fill-rule="evenodd" d="M7.775 3.275a.75.75 0 001.06 1.06l1.25-1.25a2 2 0 112.83 2.83l-2.5 2.5a2 2 0 01-2.83 0 .75.75 0 00-1.06 1.06 3.5 3.5 0 004.95 0l2.5-2.5a3.5 3.5 0 00-4.95-4.95l-1.25 1.25zm-4.69 9.64a2 2 0 010-2.83l2.5-2.5a2 2 0 012.83 0 .75.75 0 001.06-1.06 3.5 3.5 0 00-4.95 0l-2.5 2.5a3.5 3.5 0 004.95 4.95l1.25-1.25a.75.75 0 00-1.06-1.06l-1.25 1.25a2 2 0 01-2.83 0z"></path></svg></a>Configuration</h2> <p dir="auto">By default this plugin displays maps for the first ten rows, and shows a "Click to load map" prompt for rows past the first ten.</p> <p dir="auto">You can change this limit using the <code>default_maps_to_load</code> plugin configuration setting. Add this to your <code>metadata.json</code>:</p> <div class="highlight highlight-source-json notranslate position-relative overflow-auto" data-snippet-clipboard-copy-content="{ "plugins": { "datasette-leaflet-geojson": { "default_maps_to_load": 20 } } }"><pre>{ <span class="pl-ent">"plugins"</span>: { <span class="pl-ent">"datasette-leaflet-geojson"</span>: { <span class="pl-ent">"default_maps_to_load"</span>: <span class="pl-c1">20</span> } } }</pre></div> <p dir="auto">Then run Datasette with <code>datasette mydb.db -m metadata.json</code>.</p> </article></div> | 1 | public | 0 | 0 |
Links from other tables
- 6 rows from repo in releases