repos: 331151708
This data as json
| id | node_id | name | full_name | private | owner | html_url | description | fork | created_at | updated_at | pushed_at | homepage | size | stargazers_count | watchers_count | language | has_issues | has_projects | has_downloads | has_wiki | has_pages | forks_count | archived | disabled | open_issues_count | license | topics | forks | open_issues | watchers | default_branch | permissions | temp_clone_token | organization | network_count | subscribers_count | readme | readme_html | allow_forking | visibility | is_template | template_repository | web_commit_signoff_required | has_discussions |
|---|---|---|---|---|---|---|---|---|---|---|---|---|---|---|---|---|---|---|---|---|---|---|---|---|---|---|---|---|---|---|---|---|---|---|---|---|---|---|---|---|---|---|---|---|
| 331151708 | MDEwOlJlcG9zaXRvcnkzMzExNTE3MDg= | datasette-leaflet-freedraw | simonw/datasette-leaflet-freedraw | 0 | 9599 | https://github.com/simonw/datasette-leaflet-freedraw | Draw polygons on maps in Datasette | 0 | 2021-01-20T00:55:03Z | 2021-12-17T22:07:50Z | 2022-02-03T20:24:37Z | 1177 | 9 | 9 | Python | 1 | 1 | 1 | 1 | 0 | 2 | 0 | 0 | 2 | ["datasette", "datasette-io", "datasette-plugin", "leafletjs"] | 2 | 2 | 9 | main | {"admin": false, "maintain": false, "push": false, "triage": false, "pull": false} | 2 | 2 | # datasette-leaflet-freedraw [](https://pypi.org/project/datasette-leaflet-freedraw/) [](https://github.com/simonw/datasette-leaflet-freedraw/releases) [](https://github.com/simonw/datasette-leaflet-freedraw/actions?query=workflow%3ATest) [](https://github.com/simonw/datasette-leaflet-freedraw/blob/main/LICENSE) Draw polygons on maps in Datasette Project background: [Drawing shapes on a map to query a SpatiaLite database](https://simonwillison.net/2021/Jan/24/drawing-shapes-spatialite/). ## Installation Install this plugin in the same environment as Datasette. $ datasette install datasette-leaflet-freedraw ## Usage If a table has a SpatiaLite `geometry` column, the plugin will add a map interface to the table page allowing users to draw a shape on the map to find rows with a geometry that intersects that shape. The plugin can also work with arbitrary SQL queries. There it looks for input fields with a name of `freedraw` or that ends in `_freedraw` and replaces them with a map interface. The map interface uses the [FreeDraw](https://freedraw.herokuapp.com/) Leaflet plugin. ## Demo You can try out this plugin to run searches against the GreenInfo Network California Protected Areas Database. Here's [an example query](https://calands.datasettes.com/calands?sql=select%0D%0A++AsGeoJSON%28geometry%29%2C+*%0D%0Afrom%0D%0A++CPAD_2020a_SuperUnits%0D%0Awhere%0D%0A++PARK_NAME+like+%27%25mini%25%27+and%0D%0A++Intersects%28GeomFromGeoJSON%28%3Afreedraw%29%2C+geometry%29+%3D+1%0D%0A++and+CPAD_2020a_SuperUnits.rowid+in+%28%0D%0A++++select%0D%0A++++++rowid%0D%0A++++from%0D%0A++++++SpatialIndex%0D%0A++++where%0D%0A++++++f_table_name+%3D+%27CPAD_2020a_SuperUnits%27%0D%0A++++++and+search_frame+%3D+GeomFromGeoJSON%28%3Afreedraw%29%0D%0A++%29&freedraw=%7B%22type%22%3A%22MultiPolygon%22%2C%22coordinates%22%3A%5B%5B%5B%5B-122.42202758789064%2C37.82280243352759%5D%2C%5B-122.39868164062501%2C37.823887203271454%5D%2C%5B-122.38220214843751%2C37.81846319511331%5D%2C%5B-122.35061645507814%2C37.77071473849611%5D%2C%5B-122.34924316406251%2C37.74465712069939%5D%2C%5B-122.37258911132814%2C37.703380457832374%5D%2C%5B-122.39044189453125%2C37.690340943717715%5D%2C%5B-122.41241455078126%2C37.680559803205135%5D%2C%5B-122.44262695312501%2C37.67295135774715%5D%2C%5B-122.47283935546876%2C37.67295135774715%5D%2C%5B-122.52502441406251%2C37.68382032669382%5D%2C%5B-122.53463745117189%2C37.6892542140253%5D%2C%5B-122.54699707031251%2C37.690340943717715%5D%2C%5B-122.55798339843751%2C37.72945260537781%5D%2C%5B-122.54287719726564%2C37.77831314799672%5D%2C%5B-122.49893188476564%2C37.81303878836991%5D%2C%5B-122.46185302734376%2C37.82822612280363%5D%2C%5B-122.42889404296876%2C37.82822612280363%5D%2C%5B-122.42202758789064%2C37.82280243352759%5D%5D%5D%5D%7D) showing mini parks in San Francisco: ```sql select AsGeoJSON(geometry), * from CPAD_2020a_SuperUnits where PARK_NAME like '%mini%' and Intersects(GeomFromGeoJSON(:freedraw), geometry) = 1 and CPAD_2020a_SuperUnits.rowid in ( select rowid from SpatialIndex where f_table_name = 'CPAD_2020a_SuperUnits' and search_frame = GeomFromGeoJSON(:freedraw) ) ``` 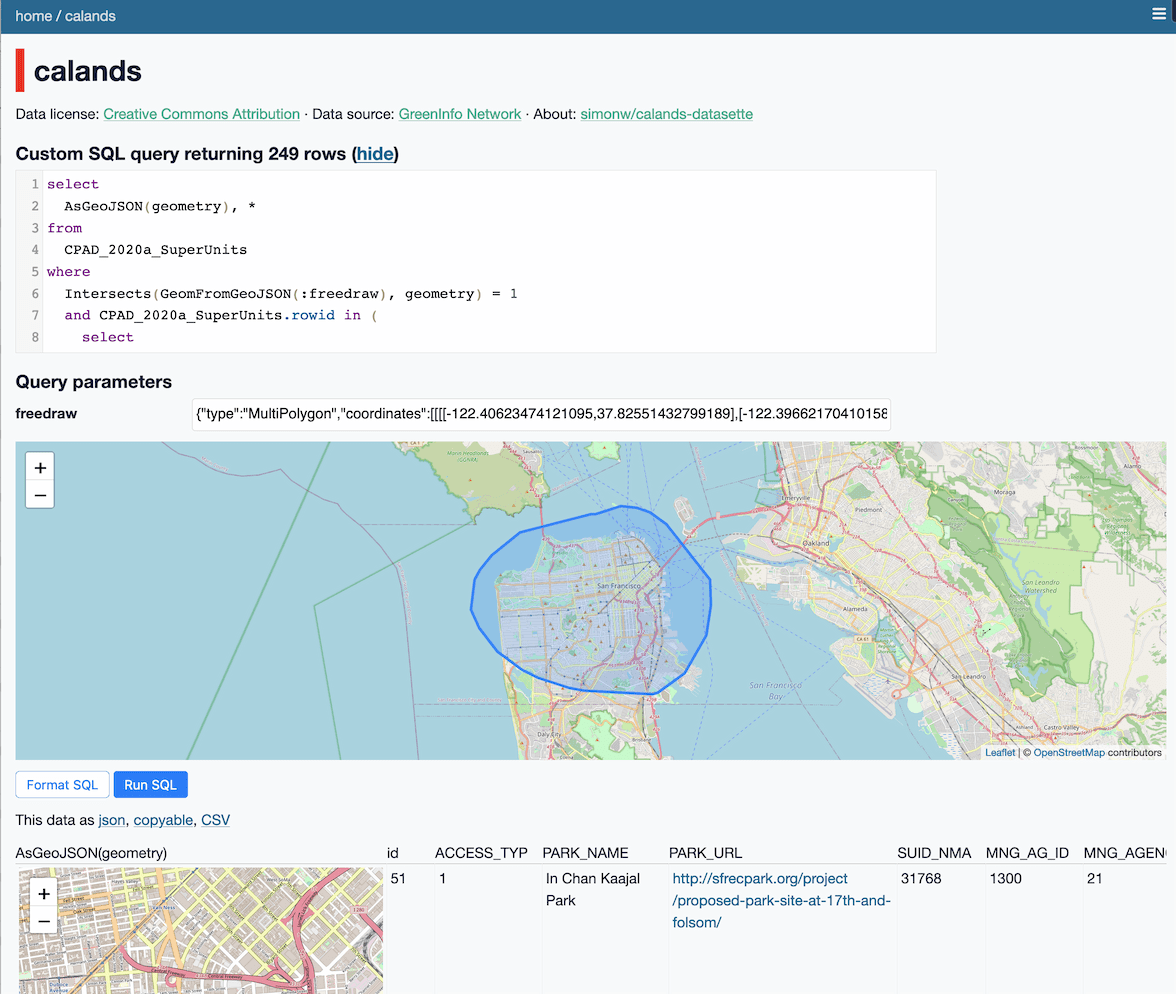 ## Development To set up this plugin locally, first checkout the code. Then create a new virtual environment: cd datasette-leaflet-freedraw python3 -mvenv venv source venv/bin/activate Or if you are using `pipenv`: pipenv shell Now install the dependencies and tests: pip install -e '.[test]' To run the tests: pytest | <div id="readme" class="md" data-path="README.md"><article class="markdown-body entry-content container-lg" itemprop="text"><h1 dir="auto"><a id="user-content-datasette-leaflet-freedraw" class="anchor" aria-hidden="true" href="#user-content-datasette-leaflet-freedraw"><svg class="octicon octicon-link" viewBox="0 0 16 16" version="1.1" width="16" height="16" aria-hidden="true"><path fill-rule="evenodd" d="M7.775 3.275a.75.75 0 001.06 1.06l1.25-1.25a2 2 0 112.83 2.83l-2.5 2.5a2 2 0 01-2.83 0 .75.75 0 00-1.06 1.06 3.5 3.5 0 004.95 0l2.5-2.5a3.5 3.5 0 00-4.95-4.95l-1.25 1.25zm-4.69 9.64a2 2 0 010-2.83l2.5-2.5a2 2 0 012.83 0 .75.75 0 001.06-1.06 3.5 3.5 0 00-4.95 0l-2.5 2.5a3.5 3.5 0 004.95 4.95l1.25-1.25a.75.75 0 00-1.06-1.06l-1.25 1.25a2 2 0 01-2.83 0z"></path></svg></a>datasette-leaflet-freedraw</h1> <p dir="auto"><a href="https://pypi.org/project/datasette-leaflet-freedraw/" rel="nofollow"><img src="https://camo.githubusercontent.com/43771dd02f1327b1f2ae2bdd743e01865626d143ca9e98a37700a8747300465f/68747470733a2f2f696d672e736869656c64732e696f2f707970692f762f6461746173657474652d6c6561666c65742d66726565647261772e737667" alt="PyPI" data-canonical-src="https://img.shields.io/pypi/v/datasette-leaflet-freedraw.svg" style="max-width: 100%;"></a> <a href="https://github.com/simonw/datasette-leaflet-freedraw/releases"><img src="https://camo.githubusercontent.com/8c5d6738c95e5fb3628c688c1eb79e970c822e9880493b52f0a62089e1b3e40c/68747470733a2f2f696d672e736869656c64732e696f2f6769746875622f762f72656c656173652f73696d6f6e772f6461746173657474652d6c6561666c65742d66726565647261773f696e636c7564655f70726572656c6561736573266c6162656c3d6368616e67656c6f67" alt="Changelog" data-canonical-src="https://img.shields.io/github/v/release/simonw/datasette-leaflet-freedraw?include_prereleases&label=changelog" style="max-width: 100%;"></a> <a href="https://github.com/simonw/datasette-leaflet-freedraw/actions?query=workflow%3ATest"><img src="https://github.com/simonw/datasette-leaflet-freedraw/workflows/Test/badge.svg" alt="Tests" style="max-width: 100%;"></a> <a href="https://github.com/simonw/datasette-leaflet-freedraw/blob/main/LICENSE"><img src="https://camo.githubusercontent.com/1698104e976c681143eb0841f9675c6f802bb7aa832afc0c7a4e719b1f3cf955/68747470733a2f2f696d672e736869656c64732e696f2f62616467652f6c6963656e73652d417061636865253230322e302d626c75652e737667" alt="License" data-canonical-src="https://img.shields.io/badge/license-Apache%202.0-blue.svg" style="max-width: 100%;"></a></p> <p dir="auto">Draw polygons on maps in Datasette</p> <p dir="auto">Project background: <a href="https://simonwillison.net/2021/Jan/24/drawing-shapes-spatialite/" rel="nofollow">Drawing shapes on a map to query a SpatiaLite database</a>.</p> <h2 dir="auto"><a id="user-content-installation" class="anchor" aria-hidden="true" href="#user-content-installation"><svg class="octicon octicon-link" viewBox="0 0 16 16" version="1.1" width="16" height="16" aria-hidden="true"><path fill-rule="evenodd" d="M7.775 3.275a.75.75 0 001.06 1.06l1.25-1.25a2 2 0 112.83 2.83l-2.5 2.5a2 2 0 01-2.83 0 .75.75 0 00-1.06 1.06 3.5 3.5 0 004.95 0l2.5-2.5a3.5 3.5 0 00-4.95-4.95l-1.25 1.25zm-4.69 9.64a2 2 0 010-2.83l2.5-2.5a2 2 0 012.83 0 .75.75 0 001.06-1.06 3.5 3.5 0 00-4.95 0l-2.5 2.5a3.5 3.5 0 004.95 4.95l1.25-1.25a.75.75 0 00-1.06-1.06l-1.25 1.25a2 2 0 01-2.83 0z"></path></svg></a>Installation</h2> <p dir="auto">Install this plugin in the same environment as Datasette.</p> <div class="snippet-clipboard-content position-relative overflow-auto" data-snippet-clipboard-copy-content="$ datasette install datasette-leaflet-freedraw"><pre><code>$ datasette install datasette-leaflet-freedraw </code></pre></div> <h2 dir="auto"><a id="user-content-usage" class="anchor" aria-hidden="true" href="#user-content-usage"><svg class="octicon octicon-link" viewBox="0 0 16 16" version="1.1" width="16" height="16" aria-hidden="true"><path fill-rule="evenodd" d="M7.775 3.275a.75.75 0 001.06 1.06l1.25-1.25a2 2 0 112.83 2.83l-2.5 2.5a2 2 0 01-2.83 0 .75.75 0 00-1.06 1.06 3.5 3.5 0 004.95 0l2.5-2.5a3.5 3.5 0 00-4.95-4.95l-1.25 1.25zm-4.69 9.64a2 2 0 010-2.83l2.5-2.5a2 2 0 012.83 0 .75.75 0 001.06-1.06 3.5 3.5 0 00-4.95 0l-2.5 2.5a3.5 3.5 0 004.95 4.95l1.25-1.25a.75.75 0 00-1.06-1.06l-1.25 1.25a2 2 0 01-2.83 0z"></path></svg></a>Usage</h2> <p dir="auto">If a table has a SpatiaLite <code>geometry</code> column, the plugin will add a map interface to the table page allowing users to draw a shape on the map to find rows with a geometry that intersects that shape.</p> <p dir="auto">The plugin can also work with arbitrary SQL queries. There it looks for input fields with a name of <code>freedraw</code> or that ends in <code>_freedraw</code> and replaces them with a map interface.</p> <p dir="auto">The map interface uses the <a href="https://freedraw.herokuapp.com/" rel="nofollow">FreeDraw</a> Leaflet plugin.</p> <h2 dir="auto"><a id="user-content-demo" class="anchor" aria-hidden="true" href="#user-content-demo"><svg class="octicon octicon-link" viewBox="0 0 16 16" version="1.1" width="16" height="16" aria-hidden="true"><path fill-rule="evenodd" d="M7.775 3.275a.75.75 0 001.06 1.06l1.25-1.25a2 2 0 112.83 2.83l-2.5 2.5a2 2 0 01-2.83 0 .75.75 0 00-1.06 1.06 3.5 3.5 0 004.95 0l2.5-2.5a3.5 3.5 0 00-4.95-4.95l-1.25 1.25zm-4.69 9.64a2 2 0 010-2.83l2.5-2.5a2 2 0 012.83 0 .75.75 0 001.06-1.06 3.5 3.5 0 00-4.95 0l-2.5 2.5a3.5 3.5 0 004.95 4.95l1.25-1.25a.75.75 0 00-1.06-1.06l-1.25 1.25a2 2 0 01-2.83 0z"></path></svg></a>Demo</h2> <p dir="auto">You can try out this plugin to run searches against the GreenInfo Network California Protected Areas Database. Here's <a href="https://calands.datasettes.com/calands?sql=select%0D%0A++AsGeoJSON%28geometry%29%2C+*%0D%0Afrom%0D%0A++CPAD_2020a_SuperUnits%0D%0Awhere%0D%0A++PARK_NAME+like+%27%25mini%25%27+and%0D%0A++Intersects%28GeomFromGeoJSON%28%3Afreedraw%29%2C+geometry%29+%3D+1%0D%0A++and+CPAD_2020a_SuperUnits.rowid+in+%28%0D%0A++++select%0D%0A++++++rowid%0D%0A++++from%0D%0A++++++SpatialIndex%0D%0A++++where%0D%0A++++++f_table_name+%3D+%27CPAD_2020a_SuperUnits%27%0D%0A++++++and+search_frame+%3D+GeomFromGeoJSON%28%3Afreedraw%29%0D%0A++%29&freedraw=%7B%22type%22%3A%22MultiPolygon%22%2C%22coordinates%22%3A%5B%5B%5B%5B-122.42202758789064%2C37.82280243352759%5D%2C%5B-122.39868164062501%2C37.823887203271454%5D%2C%5B-122.38220214843751%2C37.81846319511331%5D%2C%5B-122.35061645507814%2C37.77071473849611%5D%2C%5B-122.34924316406251%2C37.74465712069939%5D%2C%5B-122.37258911132814%2C37.703380457832374%5D%2C%5B-122.39044189453125%2C37.690340943717715%5D%2C%5B-122.41241455078126%2C37.680559803205135%5D%2C%5B-122.44262695312501%2C37.67295135774715%5D%2C%5B-122.47283935546876%2C37.67295135774715%5D%2C%5B-122.52502441406251%2C37.68382032669382%5D%2C%5B-122.53463745117189%2C37.6892542140253%5D%2C%5B-122.54699707031251%2C37.690340943717715%5D%2C%5B-122.55798339843751%2C37.72945260537781%5D%2C%5B-122.54287719726564%2C37.77831314799672%5D%2C%5B-122.49893188476564%2C37.81303878836991%5D%2C%5B-122.46185302734376%2C37.82822612280363%5D%2C%5B-122.42889404296876%2C37.82822612280363%5D%2C%5B-122.42202758789064%2C37.82280243352759%5D%5D%5D%5D%7D" rel="nofollow">an example query</a> showing mini parks in San Francisco:</p> <div class="highlight highlight-source-sql position-relative overflow-auto" data-snippet-clipboard-copy-content="select AsGeoJSON(geometry), * from CPAD_2020a_SuperUnits where PARK_NAME like '%mini%' and Intersects(GeomFromGeoJSON(:freedraw), geometry) = 1 and CPAD_2020a_SuperUnits.rowid in ( select rowid from SpatialIndex where f_table_name = 'CPAD_2020a_SuperUnits' and search_frame = GeomFromGeoJSON(:freedraw) )"><pre><span class="pl-k">select</span> AsGeoJSON(geometry), <span class="pl-k">*</span> <span class="pl-k">from</span> CPAD_2020a_SuperUnits <span class="pl-k">where</span> PARK_NAME <span class="pl-k">like</span> <span class="pl-s"><span class="pl-pds">'</span>%mini%<span class="pl-pds">'</span></span> <span class="pl-k">and</span> Intersects(GeomFromGeoJSON(:freedraw), geometry) <span class="pl-k">=</span> <span class="pl-c1">1</span> <span class="pl-k">and</span> <span class="pl-c1">CPAD_2020a_SuperUnits</span>.<span class="pl-c1">rowid</span> <span class="pl-k">in</span> ( <span class="pl-k">select</span> rowid <span class="pl-k">from</span> SpatialIndex <span class="pl-k">where</span> f_table_name <span class="pl-k">=</span> <span class="pl-s"><span class="pl-pds">'</span>CPAD_2020a_SuperUnits<span class="pl-pds">'</span></span> <span class="pl-k">and</span> search_frame <span class="pl-k">=</span> GeomFromGeoJSON(:freedraw) )</pre></div> <p dir="auto"><a target="_blank" rel="noopener noreferrer" href="https://camo.githubusercontent.com/56a2ed7e65e28e726d4c3abfbe56bd7960524e6af6512fc2cee083bdd7fcd863/68747470733a2f2f7374617469632e73696d6f6e77696c6c69736f6e2e6e65742f7374617469632f323032312f6461746173657474652d6c6561666c65742d66726565647261772e706e67"><img src="https://camo.githubusercontent.com/56a2ed7e65e28e726d4c3abfbe56bd7960524e6af6512fc2cee083bdd7fcd863/68747470733a2f2f7374617469632e73696d6f6e77696c6c69736f6e2e6e65742f7374617469632f323032312f6461746173657474652d6c6561666c65742d66726565647261772e706e67" alt="Screenshot of the plugin in action" data-canonical-src="https://static.simonwillison.net/static/2021/datasette-leaflet-freedraw.png" style="max-width: 100%;"></a></p> <h2 dir="auto"><a id="user-content-development" class="anchor" aria-hidden="true" href="#user-content-development"><svg class="octicon octicon-link" viewBox="0 0 16 16" version="1.1" width="16" height="16" aria-hidden="true"><path fill-rule="evenodd" d="M7.775 3.275a.75.75 0 001.06 1.06l1.25-1.25a2 2 0 112.83 2.83l-2.5 2.5a2 2 0 01-2.83 0 .75.75 0 00-1.06 1.06 3.5 3.5 0 004.95 0l2.5-2.5a3.5 3.5 0 00-4.95-4.95l-1.25 1.25zm-4.69 9.64a2 2 0 010-2.83l2.5-2.5a2 2 0 012.83 0 .75.75 0 001.06-1.06 3.5 3.5 0 00-4.95 0l-2.5 2.5a3.5 3.5 0 004.95 4.95l1.25-1.25a.75.75 0 00-1.06-1.06l-1.25 1.25a2 2 0 01-2.83 0z"></path></svg></a>Development</h2> <p dir="auto">To set up this plugin locally, first checkout the code. Then create a new virtual environment:</p> <div class="snippet-clipboard-content position-relative overflow-auto" data-snippet-clipboard-copy-content="cd datasette-leaflet-freedraw python3 -mvenv venv source venv/bin/activate"><pre><code>cd datasette-leaflet-freedraw python3 -mvenv venv source venv/bin/activate </code></pre></div> <p dir="auto">Or if you are using <code>pipenv</code>:</p> <div class="snippet-clipboard-content position-relative overflow-auto" data-snippet-clipboard-copy-content="pipenv shell"><pre><code>pipenv shell </code></pre></div> <p dir="auto">Now install the dependencies and tests:</p> <div class="snippet-clipboard-content position-relative overflow-auto" data-snippet-clipboard-copy-content="pip install -e '.[test]'"><pre><code>pip install -e '.[test]' </code></pre></div> <p dir="auto">To run the tests:</p> <div class="snippet-clipboard-content position-relative overflow-auto" data-snippet-clipboard-copy-content="pytest"><pre><code>pytest </code></pre></div> </article></div> | 1 | public | 0 |
Links from other tables
- 9 rows from repo in releases