repos: 361014273
This data as json
| id | node_id | name | full_name | private | owner | html_url | description | fork | created_at | updated_at | pushed_at | homepage | size | stargazers_count | watchers_count | language | has_issues | has_projects | has_downloads | has_wiki | has_pages | forks_count | archived | disabled | open_issues_count | license | topics | forks | open_issues | watchers | default_branch | permissions | temp_clone_token | organization | network_count | subscribers_count | readme | readme_html | allow_forking | visibility | is_template | template_repository | web_commit_signoff_required | has_discussions |
|---|---|---|---|---|---|---|---|---|---|---|---|---|---|---|---|---|---|---|---|---|---|---|---|---|---|---|---|---|---|---|---|---|---|---|---|---|---|---|---|---|---|---|---|---|
| 361014273 | MDEwOlJlcG9zaXRvcnkzNjEwMTQyNzM= | datasette-dashboards | rclement/datasette-dashboards | 0 | 1238873 | https://github.com/rclement/datasette-dashboards | Datasette plugin providing data dashboards from metadata | 0 | 2021-04-23T21:56:48Z | 2022-09-21T13:03:39Z | 2022-10-07T07:18:03Z | https://datasette-dashboards-demo.vercel.app | 1746 | 74 | 74 | Python | 1 | 1 | 1 | 1 | 0 | 3 | 0 | 0 | 3 | apache-2.0 | ["dashboards", "data-visualization", "datasette", "datasette-io", "datasette-plugin", "sql", "vega-lite"] | 3 | 3 | 74 | master | {"admin": false, "maintain": false, "push": false, "triage": false, "pull": false} | 3 | 1 | # datasette-dashboards > Datasette plugin providing data dashboards from metadata [](https://pypi.org/project/datasette-dashboards/) [](https://github.com/rclement/datasette-dashboards/actions/workflows/ci-cd.yml) [](https://codecov.io/gh/rclement/datasette-dashboards) [](https://github.com/rclement/datasette-dashboards/blob/master/LICENSE) Try out a live demo at [https://datasette-dashboards-demo.vercel.app](https://datasette-dashboards-demo.vercel.app/-/dashboards) **WARNING**: this plugin is still experimental and not ready for production. Some breaking changes might happen between releases before reaching a stable version. Use it at your own risks! 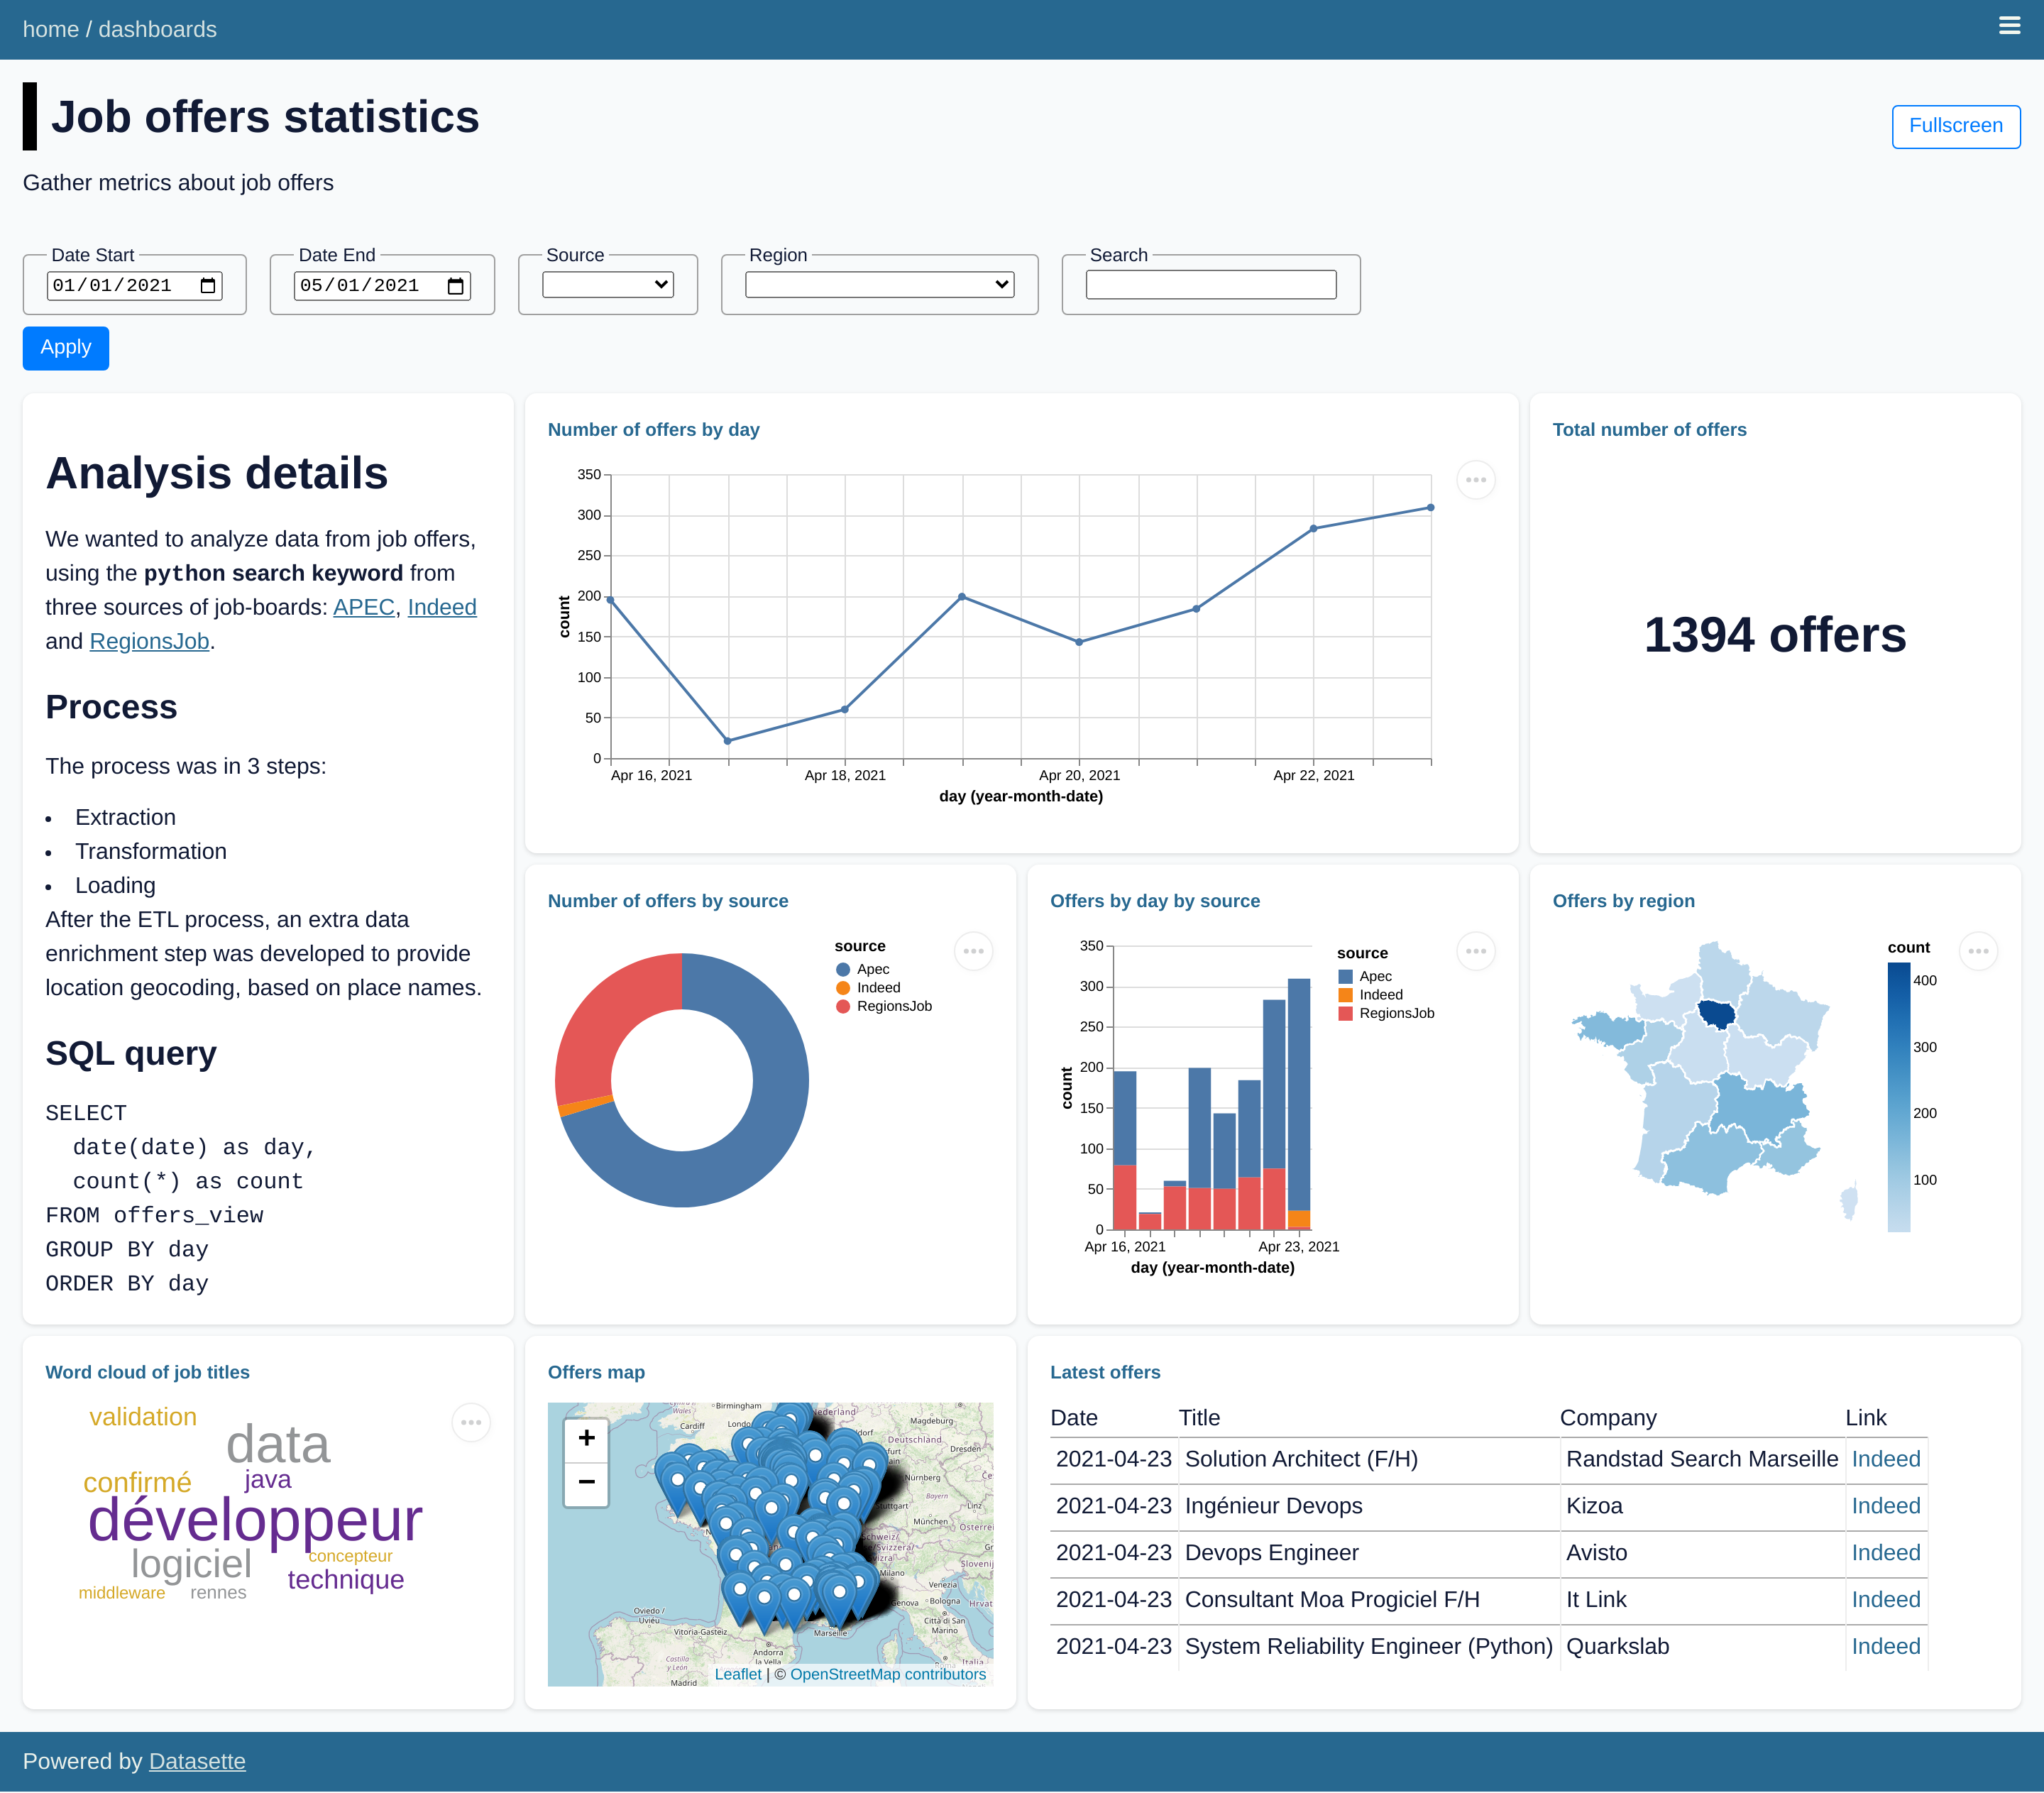 ## Installation Install this plugin in the same environment as Datasette: ```bash $ datasette install datasette-dashboards ``` ## Usage Define dashboards within `metadata.yml` / `metadata.json`: ```yaml plugins: datasette-dashboards: my-dashboard: title: My Dashboard description: Showing some nice metrics layout: - [analysis-note, events-count] - [analysis-note, events-source] filters: date_start: name: Date Start type: date default: "2021-01-01" date_end: name: Date End type: date charts: analysis-note: library: markdown display: |- # Analysis notes > A quick rundown of events statistics and KPIs events-count: title: Total number of events db: jobs query: SELECT count(*) as count FROM events library: metric display: field: count prefix: suffix: events-source: title: Number of events by source db: jobs query: SELECT source, count(*) as count FROM events WHERE TRUE [[ AND date >= date(:date_start) ]] [[ AND date <= date(:date_end) ]] GROUP BY source ORDER BY count DESC library: vega display: mark: { type: bar, tooltip: true } encoding: color: { field: source, type: nominal } theta: { field: count, type: quantitative } ``` A new menu entry is now available, pointing at `/-/dashboards` to access all defined dashboards. ### Properties Dashboard properties: | Property | Type | Description | | ------------- | -------- | --------------------- | | `title` | `string` | Dashboard title | | `description` | `string` | Dashboard description | | `layout` | `array` | Dashboard layout | | `filters` | `object` | Dashboard filters | Dashboard filters: | Property | Type | Description | | --------- | ------------------ | -------------------------------------- | | `name` | `string` | Filter display name | | `type` | `string` | Filter type (`text`, `date`, `number`) | | `default` | `string`, `number` | (optional) Filter default value | | `min` | `number` | (optional) Filter minimum value | | `max` | `number` | (optional) Filter maximum value | | `step` | `number` | (optional) Filter stepping value | Common chart properties for all chart types: | Property | Type | Description | | --------- | -------- | -------------------------------------------------------- | | `title` | `string` | Chart title | | `db` | `string` | Database name against which to run the query | | `query` | `string` | SQL query to run and extract data from | | `library` | `string` | One of supported libraries: `vega`, `markdown`, `metric` | | `display` | `object` | Chart display specification (depend on the used library) | To define SQL queries using dashboard filters: ```sql SELECT * FROM mytable [[ WHERE col >= :my_filter ]] ``` ```sql SELECT * FROM mytable WHERE TRUE [[ AND col1 = :my_filter_1 ]] [[ AND col2 = :my_filter_2 ]] ``` #### Vega properties Available configuration for `vega` charts: | Property | Type | Description | | --------- | -------- | ------------------------- | | `library` | `string` | Must be set to `vega` | | `display` | `object` | Vega specification object | Notes about the `display` property: - Requires a valid [Vega specification object](https://vega.github.io/vega-lite/docs/) - Some fields are pre-defined: `$schema`, `title`, `width`, `view`, `config`, `data` - All fields are passed along as-is (overriding pre-defined fields if any) - Only `mark` and `encoding` fields are required as the bare-minimum #### Markdown properties Available configuration for `markdown` chart: | Property | Type | Description | | --------- | -------- | ------------------------------------------------- | | `library` | `string` | Must be set to `markdown` | | `display` | `string` | Multi-line string containing the Markdown content | Note : - Some common properties do not apply and can be omitted: `title`, `db`, `query` - Markdown rendering is done by [`datasette-render-markdown`](https://datasette.io/plugins/datasette-render-markdown) - To configure Markdown rendering, extensions can be enabled in [metadata](https://datasette.io/plugins/datasette-render-markdown#user-content-markdown-extensions) #### Metric properties Available configuration for `metric` chart: | Property | Type | Description | | ---------------- | -------- | ----------------------------------------- | | `library` | `string` | Must be set to `metric` | | `display.field` | `string` | Numerical field to be displayed as metric | | `display.prefix` | `string` | Prefix to be displayed before metric | | `display.suffix` | `string` | Prefix to be displayed after metric | Note: - The `display.field` must reference a single-numerical value from the SQL query (e.g. numerical `number` field in `SELECT count(*) as number FROM events`) ### Dashboard layout The default dashboard layout will present two charts per row (one per row on mobile). To make use of custom dashboard layout using [CSS Grid Layout](https://developer.mozilla.org/en-US/docs/Web/CSS/CSS_Grid_Layout), define the `layout` array property as a grid / matrix: - Each entry represents a row of charts - Each column is referring a chart by its property name ## Development To set up this plugin locally, first checkout the code. Then create a new virtual environment and the required dependencies: ```bash pipenv install -d pipenv shell ``` To run the tests: ```bash pytest ``` ## Demo With the developmnent environment setup, you can run the demo locally: ```bash datasette --metadata demo/metadata.yml demo/jobs.db ``` ## License Licensed under Apache License, Version 2.0 Copyright (c) 2021 - present Romain Clement | <div id="readme" class="md" data-path="README.md"><article class="markdown-body entry-content container-lg" itemprop="text"><h1 dir="auto"><a id="user-content-datasette-dashboards" class="anchor" aria-hidden="true" href="#user-content-datasette-dashboards"><svg class="octicon octicon-link" viewBox="0 0 16 16" version="1.1" width="16" height="16" aria-hidden="true"><path fill-rule="evenodd" d="M7.775 3.275a.75.75 0 001.06 1.06l1.25-1.25a2 2 0 112.83 2.83l-2.5 2.5a2 2 0 01-2.83 0 .75.75 0 00-1.06 1.06 3.5 3.5 0 004.95 0l2.5-2.5a3.5 3.5 0 00-4.95-4.95l-1.25 1.25zm-4.69 9.64a2 2 0 010-2.83l2.5-2.5a2 2 0 012.83 0 .75.75 0 001.06-1.06 3.5 3.5 0 00-4.95 0l-2.5 2.5a3.5 3.5 0 004.95 4.95l1.25-1.25a.75.75 0 00-1.06-1.06l-1.25 1.25a2 2 0 01-2.83 0z"></path></svg></a>datasette-dashboards</h1> <blockquote> <p dir="auto">Datasette plugin providing data dashboards from metadata</p> </blockquote> <p dir="auto"><a href="https://pypi.org/project/datasette-dashboards/" rel="nofollow"><img src="https://camo.githubusercontent.com/f362a9e19c9666117e279326df7065185827fbec6acab7c6ae6c5e7e379191db/68747470733a2f2f696d672e736869656c64732e696f2f707970692f762f6461746173657474652d64617368626f617264732e737667" alt="PyPI" data-canonical-src="https://img.shields.io/pypi/v/datasette-dashboards.svg" style="max-width: 100%;"></a> <a href="https://github.com/rclement/datasette-dashboards/actions/workflows/ci-cd.yml"><img src="https://github.com/rclement/datasette-dashboards/actions/workflows/ci-cd.yml/badge.svg" alt="CI/CD" style="max-width: 100%;"></a> <a href="https://codecov.io/gh/rclement/datasette-dashboards" rel="nofollow"><img src="https://camo.githubusercontent.com/12d74ac8b571a59d446ce62428195bfc76d2027e8394fb3cb1e8584bdf025c9f/68747470733a2f2f696d672e736869656c64732e696f2f636f6465636f762f632f6769746875622f72636c656d656e742f6461746173657474652d64617368626f61726473" alt="Coverage Status" data-canonical-src="https://img.shields.io/codecov/c/github/rclement/datasette-dashboards" style="max-width: 100%;"></a> <a href="https://github.com/rclement/datasette-dashboards/blob/master/LICENSE"><img src="https://camo.githubusercontent.com/210d7ef998772287f630b1a00a40abc4c413c989b0c8757f93ff9c674d46f5c7/68747470733a2f2f696d672e736869656c64732e696f2f6769746875622f6c6963656e73652f72636c656d656e742f6461746173657474652d64617368626f61726473" alt="License" data-canonical-src="https://img.shields.io/github/license/rclement/datasette-dashboards" style="max-width: 100%;"></a></p> <p dir="auto">Try out a live demo at <a href="https://datasette-dashboards-demo.vercel.app/-/dashboards" rel="nofollow">https://datasette-dashboards-demo.vercel.app</a></p> <p dir="auto"><strong>WARNING</strong>: this plugin is still experimental and not ready for production. Some breaking changes might happen between releases before reaching a stable version. Use it at your own risks!</p> <p dir="auto"><a target="_blank" rel="noopener noreferrer nofollow" href="https://raw.githubusercontent.com/rclement/datasette-dashboards/master/demo/datasette-dashboards-demo.png"><img src="https://raw.githubusercontent.com/rclement/datasette-dashboards/master/demo/datasette-dashboards-demo.png" alt="Datasette Dashboards Demo" style="max-width: 100%;"></a></p> <h2 dir="auto"><a id="user-content-installation" class="anchor" aria-hidden="true" href="#user-content-installation"><svg class="octicon octicon-link" viewBox="0 0 16 16" version="1.1" width="16" height="16" aria-hidden="true"><path fill-rule="evenodd" d="M7.775 3.275a.75.75 0 001.06 1.06l1.25-1.25a2 2 0 112.83 2.83l-2.5 2.5a2 2 0 01-2.83 0 .75.75 0 00-1.06 1.06 3.5 3.5 0 004.95 0l2.5-2.5a3.5 3.5 0 00-4.95-4.95l-1.25 1.25zm-4.69 9.64a2 2 0 010-2.83l2.5-2.5a2 2 0 012.83 0 .75.75 0 001.06-1.06 3.5 3.5 0 00-4.95 0l-2.5 2.5a3.5 3.5 0 004.95 4.95l1.25-1.25a.75.75 0 00-1.06-1.06l-1.25 1.25a2 2 0 01-2.83 0z"></path></svg></a>Installation</h2> <p dir="auto">Install this plugin in the same environment as Datasette:</p> <div class="highlight highlight-source-shell notranslate position-relative overflow-auto" dir="auto" data-snippet-clipboard-copy-content="$ datasette install datasette-dashboards"><pre>$ datasette install datasette-dashboards</pre></div> <h2 dir="auto"><a id="user-content-usage" class="anchor" aria-hidden="true" href="#user-content-usage"><svg class="octicon octicon-link" viewBox="0 0 16 16" version="1.1" width="16" height="16" aria-hidden="true"><path fill-rule="evenodd" d="M7.775 3.275a.75.75 0 001.06 1.06l1.25-1.25a2 2 0 112.83 2.83l-2.5 2.5a2 2 0 01-2.83 0 .75.75 0 00-1.06 1.06 3.5 3.5 0 004.95 0l2.5-2.5a3.5 3.5 0 00-4.95-4.95l-1.25 1.25zm-4.69 9.64a2 2 0 010-2.83l2.5-2.5a2 2 0 012.83 0 .75.75 0 001.06-1.06 3.5 3.5 0 00-4.95 0l-2.5 2.5a3.5 3.5 0 004.95 4.95l1.25-1.25a.75.75 0 00-1.06-1.06l-1.25 1.25a2 2 0 01-2.83 0z"></path></svg></a>Usage</h2> <p dir="auto">Define dashboards within <code>metadata.yml</code> / <code>metadata.json</code>:</p> <div class="highlight highlight-source-yaml notranslate position-relative overflow-auto" dir="auto" data-snippet-clipboard-copy-content="plugins: datasette-dashboards: my-dashboard: title: My Dashboard description: Showing some nice metrics layout: - [analysis-note, events-count] - [analysis-note, events-source] filters: date_start: name: Date Start type: date default: "2021-01-01" date_end: name: Date End type: date charts: analysis-note: library: markdown display: |- # Analysis notes > A quick rundown of events statistics and KPIs events-count: title: Total number of events db: jobs query: SELECT count(*) as count FROM events library: metric display: field: count prefix: suffix: events-source: title: Number of events by source db: jobs query: SELECT source, count(*) as count FROM events WHERE TRUE [[ AND date >= date(:date_start) ]] [[ AND date <= date(:date_end) ]] GROUP BY source ORDER BY count DESC library: vega display: mark: { type: bar, tooltip: true } encoding: color: { field: source, type: nominal } theta: { field: count, type: quantitative }"><pre><span class="pl-ent">plugins</span>: <span class="pl-ent">datasette-dashboards</span>: <span class="pl-ent">my-dashboard</span>: <span class="pl-ent">title</span>: <span class="pl-s">My Dashboard</span> <span class="pl-ent">description</span>: <span class="pl-s">Showing some nice metrics</span> <span class="pl-ent">layout</span>: - <span class="pl-s">[analysis-note, events-count]</span> - <span class="pl-s">[analysis-note, events-source]</span> <span class="pl-ent">filters</span>: <span class="pl-ent">date_start</span>: <span class="pl-ent">name</span>: <span class="pl-s">Date Start</span> <span class="pl-ent">type</span>: <span class="pl-s">date</span> <span class="pl-ent">default</span>: <span class="pl-s"><span class="pl-pds">"</span>2021-01-01<span class="pl-pds">"</span></span> <span class="pl-ent">date_end</span>: <span class="pl-ent">name</span>: <span class="pl-s">Date End</span> <span class="pl-ent">type</span>: <span class="pl-s">date</span> <span class="pl-ent">charts</span>: <span class="pl-ent">analysis-note</span>: <span class="pl-ent">library</span>: <span class="pl-s">markdown</span> <span class="pl-ent">display</span>: <span class="pl-s">|-</span> <span class="pl-s"> # Analysis notes</span> <span class="pl-s"> > A quick rundown of events statistics and KPIs</span> <span class="pl-s"></span> <span class="pl-s"></span> <span class="pl-ent">events-count</span>: <span class="pl-ent">title</span>: <span class="pl-s">Total number of events</span> <span class="pl-ent">db</span>: <span class="pl-s">jobs</span> <span class="pl-ent">query</span>: <span class="pl-s">SELECT count(*) as count FROM events</span> <span class="pl-ent">library</span>: <span class="pl-s">metric</span> <span class="pl-ent">display</span>: <span class="pl-ent">field</span>: <span class="pl-s">count</span> <span class="pl-ent">prefix</span>: <span class="pl-ent">suffix</span>: <span class="pl-ent">events-source</span>: <span class="pl-ent">title</span>: <span class="pl-s">Number of events by source</span> <span class="pl-ent">db</span>: <span class="pl-s">jobs</span> <span class="pl-ent">query</span>: <span class="pl-s">SELECT source, count(*) as count FROM events WHERE TRUE [[ AND date >= date(:date_start) ]] [[ AND date <= date(:date_end) ]] GROUP BY source ORDER BY count DESC</span> <span class="pl-ent">library</span>: <span class="pl-s">vega</span> <span class="pl-ent">display</span>: <span class="pl-ent">mark</span>: <span class="pl-s">{ type: bar, tooltip: true }</span> <span class="pl-ent">encoding</span>: <span class="pl-ent">color</span>: <span class="pl-s">{ field: source, type: nominal }</span> <span class="pl-ent">theta</span>: <span class="pl-s">{ field: count, type: quantitative }</span></pre></div> <p dir="auto">A new menu entry is now available, pointing at <code>/-/dashboards</code> to access all defined dashboards.</p> <h3 dir="auto"><a id="user-content-properties" class="anchor" aria-hidden="true" href="#user-content-properties"><svg class="octicon octicon-link" viewBox="0 0 16 16" version="1.1" width="16" height="16" aria-hidden="true"><path fill-rule="evenodd" d="M7.775 3.275a.75.75 0 001.06 1.06l1.25-1.25a2 2 0 112.83 2.83l-2.5 2.5a2 2 0 01-2.83 0 .75.75 0 00-1.06 1.06 3.5 3.5 0 004.95 0l2.5-2.5a3.5 3.5 0 00-4.95-4.95l-1.25 1.25zm-4.69 9.64a2 2 0 010-2.83l2.5-2.5a2 2 0 012.83 0 .75.75 0 001.06-1.06 3.5 3.5 0 00-4.95 0l-2.5 2.5a3.5 3.5 0 004.95 4.95l1.25-1.25a.75.75 0 00-1.06-1.06l-1.25 1.25a2 2 0 01-2.83 0z"></path></svg></a>Properties</h3> <p dir="auto">Dashboard properties:</p> <table> <thead> <tr> <th>Property</th> <th>Type</th> <th>Description</th> </tr> </thead> <tbody> <tr> <td><code>title</code></td> <td><code>string</code></td> <td>Dashboard title</td> </tr> <tr> <td><code>description</code></td> <td><code>string</code></td> <td>Dashboard description</td> </tr> <tr> <td><code>layout</code></td> <td><code>array</code></td> <td>Dashboard layout</td> </tr> <tr> <td><code>filters</code></td> <td><code>object</code></td> <td>Dashboard filters</td> </tr> </tbody> </table> <p dir="auto">Dashboard filters:</p> <table> <thead> <tr> <th>Property</th> <th>Type</th> <th>Description</th> </tr> </thead> <tbody> <tr> <td><code>name</code></td> <td><code>string</code></td> <td>Filter display name</td> </tr> <tr> <td><code>type</code></td> <td><code>string</code></td> <td>Filter type (<code>text</code>, <code>date</code>, <code>number</code>)</td> </tr> <tr> <td><code>default</code></td> <td><code>string</code>, <code>number</code></td> <td>(optional) Filter default value</td> </tr> <tr> <td><code>min</code></td> <td><code>number</code></td> <td>(optional) Filter minimum value</td> </tr> <tr> <td><code>max</code></td> <td><code>number</code></td> <td>(optional) Filter maximum value</td> </tr> <tr> <td><code>step</code></td> <td><code>number</code></td> <td>(optional) Filter stepping value</td> </tr> </tbody> </table> <p dir="auto">Common chart properties for all chart types:</p> <table> <thead> <tr> <th>Property</th> <th>Type</th> <th>Description</th> </tr> </thead> <tbody> <tr> <td><code>title</code></td> <td><code>string</code></td> <td>Chart title</td> </tr> <tr> <td><code>db</code></td> <td><code>string</code></td> <td>Database name against which to run the query</td> </tr> <tr> <td><code>query</code></td> <td><code>string</code></td> <td>SQL query to run and extract data from</td> </tr> <tr> <td><code>library</code></td> <td><code>string</code></td> <td>One of supported libraries: <code>vega</code>, <code>markdown</code>, <code>metric</code></td> </tr> <tr> <td><code>display</code></td> <td><code>object</code></td> <td>Chart display specification (depend on the used library)</td> </tr> </tbody> </table> <p dir="auto">To define SQL queries using dashboard filters:</p> <div class="highlight highlight-source-sql notranslate position-relative overflow-auto" dir="auto" data-snippet-clipboard-copy-content="SELECT * FROM mytable [[ WHERE col >= :my_filter ]]"><pre><span class="pl-k">SELECT</span> <span class="pl-k">*</span> <span class="pl-k">FROM</span> mytable [[ <span class="pl-k">WHERE</span> col <span class="pl-k">>=</span> :my_filter ]]</pre></div> <div class="highlight highlight-source-sql notranslate position-relative overflow-auto" dir="auto" data-snippet-clipboard-copy-content="SELECT * FROM mytable WHERE TRUE [[ AND col1 = :my_filter_1 ]] [[ AND col2 = :my_filter_2 ]]"><pre><span class="pl-k">SELECT</span> <span class="pl-k">*</span> <span class="pl-k">FROM</span> mytable <span class="pl-k">WHERE</span> TRUE [[ <span class="pl-k">AND</span> col1 <span class="pl-k">=</span> :my_filter_1 ]] [[ <span class="pl-k">AND</span> col2 <span class="pl-k">=</span> :my_filter_2 ]]</pre></div> <h4 dir="auto"><a id="user-content-vega-properties" class="anchor" aria-hidden="true" href="#user-content-vega-properties"><svg class="octicon octicon-link" viewBox="0 0 16 16" version="1.1" width="16" height="16" aria-hidden="true"><path fill-rule="evenodd" d="M7.775 3.275a.75.75 0 001.06 1.06l1.25-1.25a2 2 0 112.83 2.83l-2.5 2.5a2 2 0 01-2.83 0 .75.75 0 00-1.06 1.06 3.5 3.5 0 004.95 0l2.5-2.5a3.5 3.5 0 00-4.95-4.95l-1.25 1.25zm-4.69 9.64a2 2 0 010-2.83l2.5-2.5a2 2 0 012.83 0 .75.75 0 001.06-1.06 3.5 3.5 0 00-4.95 0l-2.5 2.5a3.5 3.5 0 004.95 4.95l1.25-1.25a.75.75 0 00-1.06-1.06l-1.25 1.25a2 2 0 01-2.83 0z"></path></svg></a>Vega properties</h4> <p dir="auto">Available configuration for <code>vega</code> charts:</p> <table> <thead> <tr> <th>Property</th> <th>Type</th> <th>Description</th> </tr> </thead> <tbody> <tr> <td><code>library</code></td> <td><code>string</code></td> <td>Must be set to <code>vega</code></td> </tr> <tr> <td><code>display</code></td> <td><code>object</code></td> <td>Vega specification object</td> </tr> </tbody> </table> <p dir="auto">Notes about the <code>display</code> property:</p> <ul dir="auto"> <li>Requires a valid <a href="https://vega.github.io/vega-lite/docs/" rel="nofollow">Vega specification object</a></li> <li>Some fields are pre-defined: <code>$schema</code>, <code>title</code>, <code>width</code>, <code>view</code>, <code>config</code>, <code>data</code></li> <li>All fields are passed along as-is (overriding pre-defined fields if any)</li> <li>Only <code>mark</code> and <code>encoding</code> fields are required as the bare-minimum</li> </ul> <h4 dir="auto"><a id="user-content-markdown-properties" class="anchor" aria-hidden="true" href="#user-content-markdown-properties"><svg class="octicon octicon-link" viewBox="0 0 16 16" version="1.1" width="16" height="16" aria-hidden="true"><path fill-rule="evenodd" d="M7.775 3.275a.75.75 0 001.06 1.06l1.25-1.25a2 2 0 112.83 2.83l-2.5 2.5a2 2 0 01-2.83 0 .75.75 0 00-1.06 1.06 3.5 3.5 0 004.95 0l2.5-2.5a3.5 3.5 0 00-4.95-4.95l-1.25 1.25zm-4.69 9.64a2 2 0 010-2.83l2.5-2.5a2 2 0 012.83 0 .75.75 0 001.06-1.06 3.5 3.5 0 00-4.95 0l-2.5 2.5a3.5 3.5 0 004.95 4.95l1.25-1.25a.75.75 0 00-1.06-1.06l-1.25 1.25a2 2 0 01-2.83 0z"></path></svg></a>Markdown properties</h4> <p dir="auto">Available configuration for <code>markdown</code> chart:</p> <table> <thead> <tr> <th>Property</th> <th>Type</th> <th>Description</th> </tr> </thead> <tbody> <tr> <td><code>library</code></td> <td><code>string</code></td> <td>Must be set to <code>markdown</code></td> </tr> <tr> <td><code>display</code></td> <td><code>string</code></td> <td>Multi-line string containing the Markdown content</td> </tr> </tbody> </table> <p dir="auto">Note :</p> <ul dir="auto"> <li>Some common properties do not apply and can be omitted: <code>title</code>, <code>db</code>, <code>query</code></li> <li>Markdown rendering is done by <a href="https://datasette.io/plugins/datasette-render-markdown" rel="nofollow"><code>datasette-render-markdown</code></a></li> <li>To configure Markdown rendering, extensions can be enabled in <a href="https://datasette.io/plugins/datasette-render-markdown#user-content-markdown-extensions" rel="nofollow">metadata</a></li> </ul> <h4 dir="auto"><a id="user-content-metric-properties" class="anchor" aria-hidden="true" href="#user-content-metric-properties"><svg class="octicon octicon-link" viewBox="0 0 16 16" version="1.1" width="16" height="16" aria-hidden="true"><path fill-rule="evenodd" d="M7.775 3.275a.75.75 0 001.06 1.06l1.25-1.25a2 2 0 112.83 2.83l-2.5 2.5a2 2 0 01-2.83 0 .75.75 0 00-1.06 1.06 3.5 3.5 0 004.95 0l2.5-2.5a3.5 3.5 0 00-4.95-4.95l-1.25 1.25zm-4.69 9.64a2 2 0 010-2.83l2.5-2.5a2 2 0 012.83 0 .75.75 0 001.06-1.06 3.5 3.5 0 00-4.95 0l-2.5 2.5a3.5 3.5 0 004.95 4.95l1.25-1.25a.75.75 0 00-1.06-1.06l-1.25 1.25a2 2 0 01-2.83 0z"></path></svg></a>Metric properties</h4> <p dir="auto">Available configuration for <code>metric</code> chart:</p> <table> <thead> <tr> <th>Property</th> <th>Type</th> <th>Description</th> </tr> </thead> <tbody> <tr> <td><code>library</code></td> <td><code>string</code></td> <td>Must be set to <code>metric</code></td> </tr> <tr> <td><code>display.field</code></td> <td><code>string</code></td> <td>Numerical field to be displayed as metric</td> </tr> <tr> <td><code>display.prefix</code></td> <td><code>string</code></td> <td>Prefix to be displayed before metric</td> </tr> <tr> <td><code>display.suffix</code></td> <td><code>string</code></td> <td>Prefix to be displayed after metric</td> </tr> </tbody> </table> <p dir="auto">Note:</p> <ul dir="auto"> <li>The <code>display.field</code> must reference a single-numerical value from the SQL query (e.g. numerical <code>number</code> field in <code>SELECT count(*) as number FROM events</code>)</li> </ul> <h3 dir="auto"><a id="user-content-dashboard-layout" class="anchor" aria-hidden="true" href="#user-content-dashboard-layout"><svg class="octicon octicon-link" viewBox="0 0 16 16" version="1.1" width="16" height="16" aria-hidden="true"><path fill-rule="evenodd" d="M7.775 3.275a.75.75 0 001.06 1.06l1.25-1.25a2 2 0 112.83 2.83l-2.5 2.5a2 2 0 01-2.83 0 .75.75 0 00-1.06 1.06 3.5 3.5 0 004.95 0l2.5-2.5a3.5 3.5 0 00-4.95-4.95l-1.25 1.25zm-4.69 9.64a2 2 0 010-2.83l2.5-2.5a2 2 0 012.83 0 .75.75 0 001.06-1.06 3.5 3.5 0 00-4.95 0l-2.5 2.5a3.5 3.5 0 004.95 4.95l1.25-1.25a.75.75 0 00-1.06-1.06l-1.25 1.25a2 2 0 01-2.83 0z"></path></svg></a>Dashboard layout</h3> <p dir="auto">The default dashboard layout will present two charts per row (one per row on mobile). To make use of custom dashboard layout using <a href="https://developer.mozilla.org/en-US/docs/Web/CSS/CSS_Grid_Layout" rel="nofollow">CSS Grid Layout</a>, define the <code>layout</code> array property as a grid / matrix:</p> <ul dir="auto"> <li>Each entry represents a row of charts</li> <li>Each column is referring a chart by its property name</li> </ul> <h2 dir="auto"><a id="user-content-development" class="anchor" aria-hidden="true" href="#user-content-development"><svg class="octicon octicon-link" viewBox="0 0 16 16" version="1.1" width="16" height="16" aria-hidden="true"><path fill-rule="evenodd" d="M7.775 3.275a.75.75 0 001.06 1.06l1.25-1.25a2 2 0 112.83 2.83l-2.5 2.5a2 2 0 01-2.83 0 .75.75 0 00-1.06 1.06 3.5 3.5 0 004.95 0l2.5-2.5a3.5 3.5 0 00-4.95-4.95l-1.25 1.25zm-4.69 9.64a2 2 0 010-2.83l2.5-2.5a2 2 0 012.83 0 .75.75 0 001.06-1.06 3.5 3.5 0 00-4.95 0l-2.5 2.5a3.5 3.5 0 004.95 4.95l1.25-1.25a.75.75 0 00-1.06-1.06l-1.25 1.25a2 2 0 01-2.83 0z"></path></svg></a>Development</h2> <p dir="auto">To set up this plugin locally, first checkout the code. Then create a new virtual environment and the required dependencies:</p> <div class="highlight highlight-source-shell notranslate position-relative overflow-auto" dir="auto" data-snippet-clipboard-copy-content="pipenv install -d pipenv shell"><pre>pipenv install -d pipenv shell</pre></div> <p dir="auto">To run the tests:</p> <div class="highlight highlight-source-shell notranslate position-relative overflow-auto" dir="auto" data-snippet-clipboard-copy-content="pytest"><pre>pytest</pre></div> <h2 dir="auto"><a id="user-content-demo" class="anchor" aria-hidden="true" href="#user-content-demo"><svg class="octicon octicon-link" viewBox="0 0 16 16" version="1.1" width="16" height="16" aria-hidden="true"><path fill-rule="evenodd" d="M7.775 3.275a.75.75 0 001.06 1.06l1.25-1.25a2 2 0 112.83 2.83l-2.5 2.5a2 2 0 01-2.83 0 .75.75 0 00-1.06 1.06 3.5 3.5 0 004.95 0l2.5-2.5a3.5 3.5 0 00-4.95-4.95l-1.25 1.25zm-4.69 9.64a2 2 0 010-2.83l2.5-2.5a2 2 0 012.83 0 .75.75 0 001.06-1.06 3.5 3.5 0 00-4.95 0l-2.5 2.5a3.5 3.5 0 004.95 4.95l1.25-1.25a.75.75 0 00-1.06-1.06l-1.25 1.25a2 2 0 01-2.83 0z"></path></svg></a>Demo</h2> <p dir="auto">With the developmnent environment setup, you can run the demo locally:</p> <div class="highlight highlight-source-shell notranslate position-relative overflow-auto" dir="auto" data-snippet-clipboard-copy-content="datasette --metadata demo/metadata.yml demo/jobs.db"><pre>datasette --metadata demo/metadata.yml demo/jobs.db</pre></div> <h2 dir="auto"><a id="user-content-license" class="anchor" aria-hidden="true" href="#user-content-license"><svg class="octicon octicon-link" viewBox="0 0 16 16" version="1.1" width="16" height="16" aria-hidden="true"><path fill-rule="evenodd" d="M7.775 3.275a.75.75 0 001.06 1.06l1.25-1.25a2 2 0 112.83 2.83l-2.5 2.5a2 2 0 01-2.83 0 .75.75 0 00-1.06 1.06 3.5 3.5 0 004.95 0l2.5-2.5a3.5 3.5 0 00-4.95-4.95l-1.25 1.25zm-4.69 9.64a2 2 0 010-2.83l2.5-2.5a2 2 0 012.83 0 .75.75 0 001.06-1.06 3.5 3.5 0 00-4.95 0l-2.5 2.5a3.5 3.5 0 004.95 4.95l1.25-1.25a.75.75 0 00-1.06-1.06l-1.25 1.25a2 2 0 01-2.83 0z"></path></svg></a>License</h2> <p dir="auto">Licensed under Apache License, Version 2.0</p> <p dir="auto">Copyright (c) 2021 - present Romain Clement</p> </article></div> | 1 | public | 0 | 0 |
Links from other tables
- 0 rows from repo in releases